Practice problem
Discrete Data - Defintion & Examples
+4 contributors


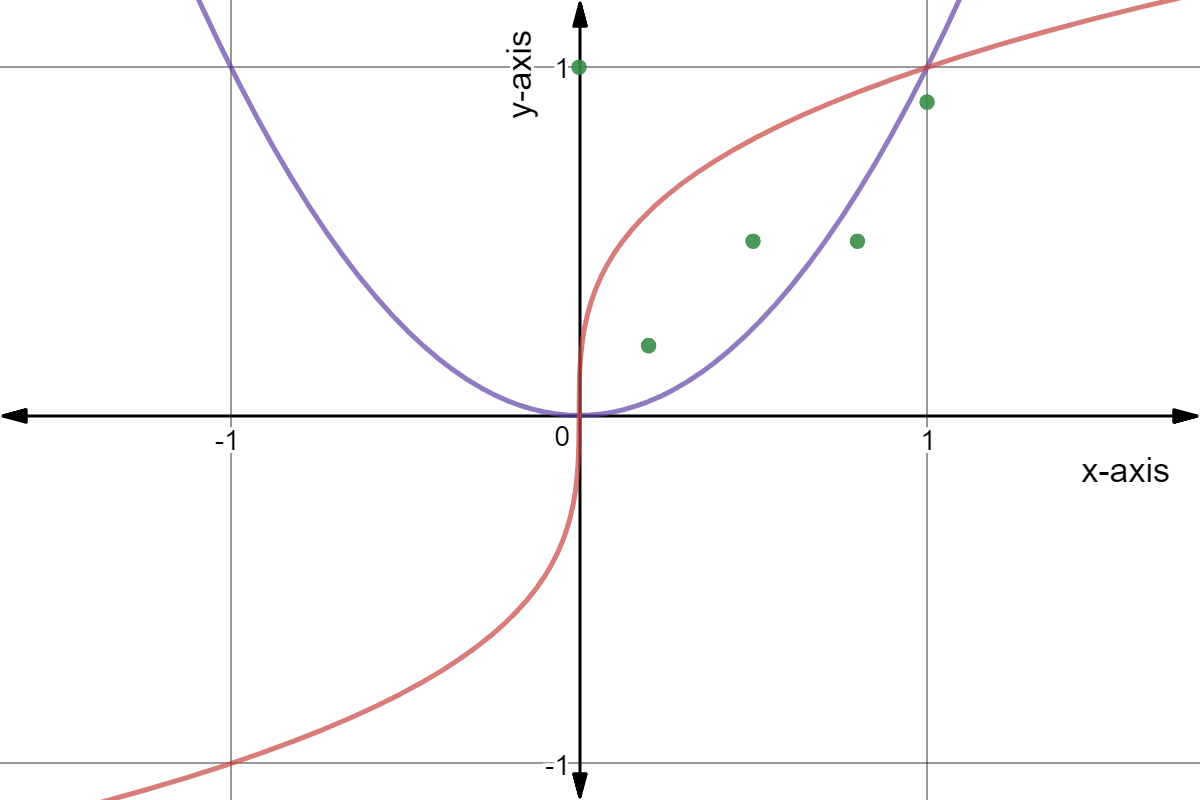
The green -values represent data taken throughout a school day at a state university. The -axis is scaled so that the first data point was collected at time , while the last data point was collected at time .
What could the -values represent? Select the best choice below.