Practice problem
Discrete Data - Defintion & Examples
+4 contributors


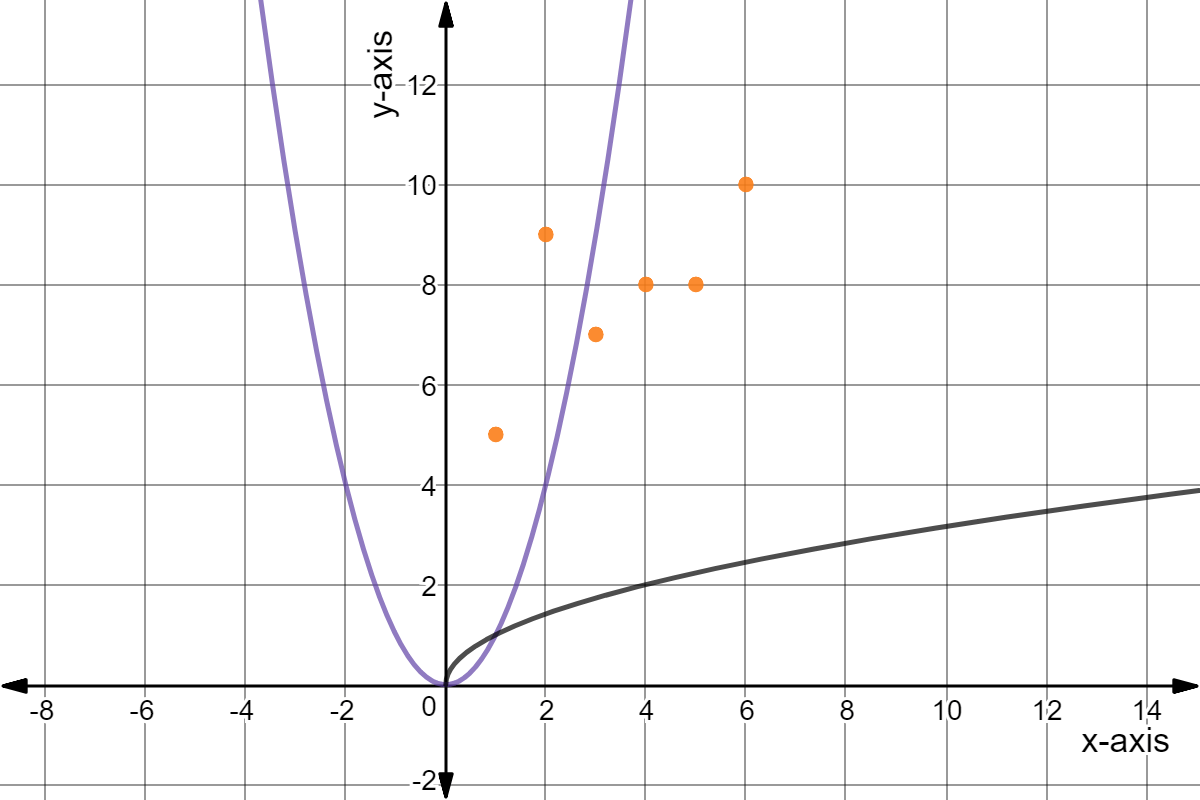
Made using Desmos
Which colored graph could represent the number of children per grade in a school? Suppose the -axis represents the grade level while the -axis represents the number of children.