Practice problem
Scatter Plots - Definition & Examples
+2 contributors
Contributors


Made using Desmos
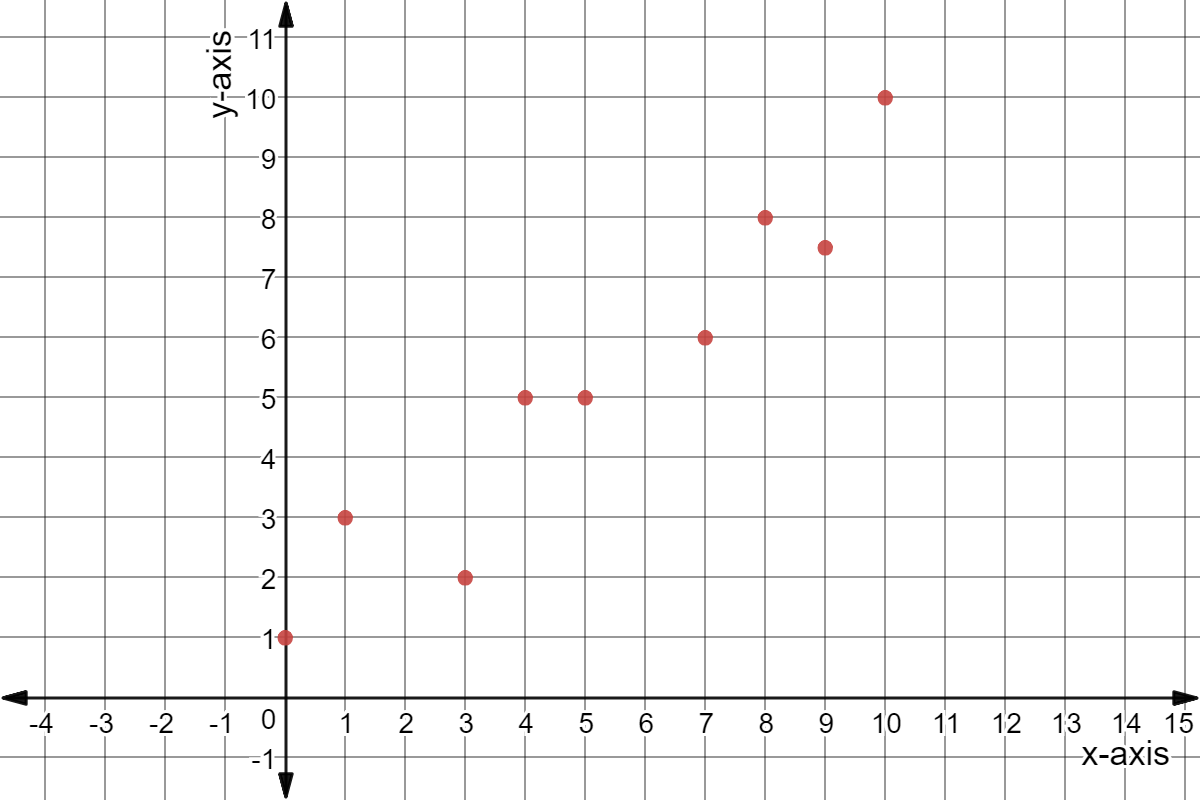
What type of correlation does the following scatter plot represent?
Practice problem
Made using Desmos
What type of correlation does the following scatter plot represent?