Practice problem
Scatter Plots - Definition & Examples
+2 contributors
Contributors


Made using Desmos
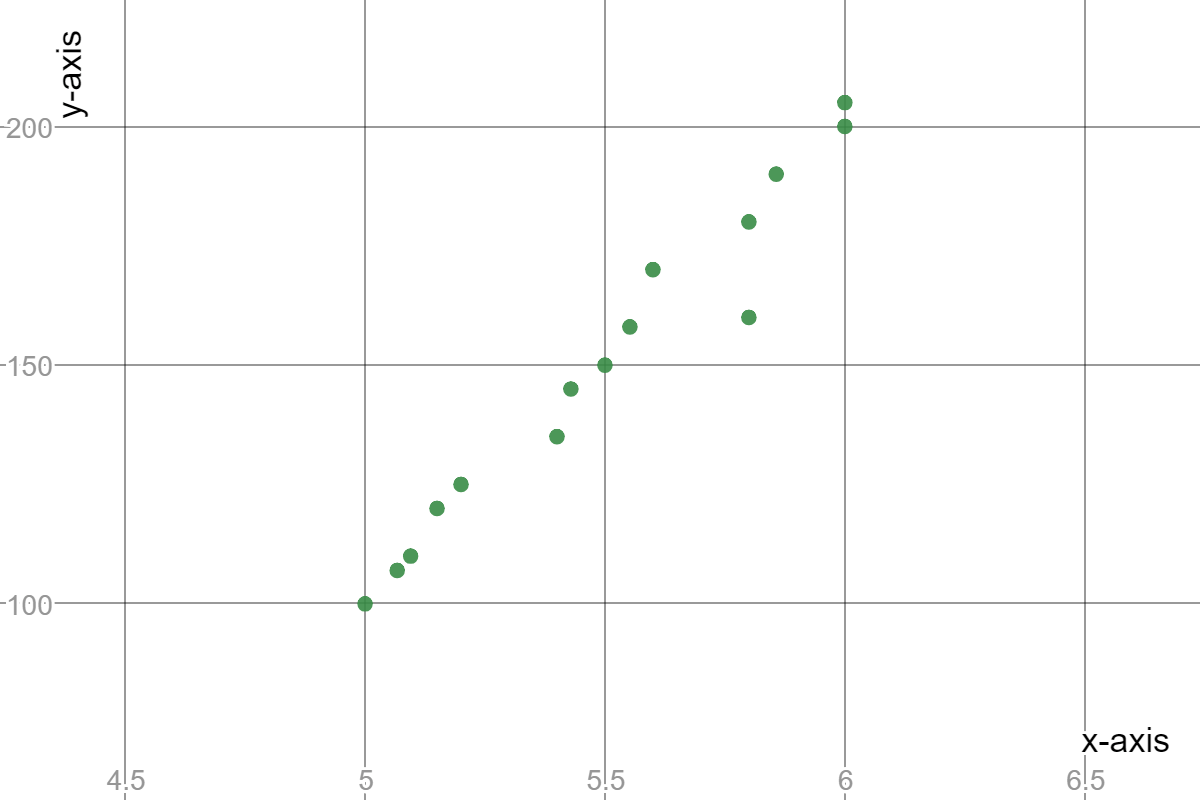
Which of the following sets of data could represent the scatter plot above?
Practice problem
Made using Desmos
Which of the following sets of data could represent the scatter plot above?