Practice problem
Scatter Plots - Definition & Examples
+2 contributors
Contributors


Made using Desmos
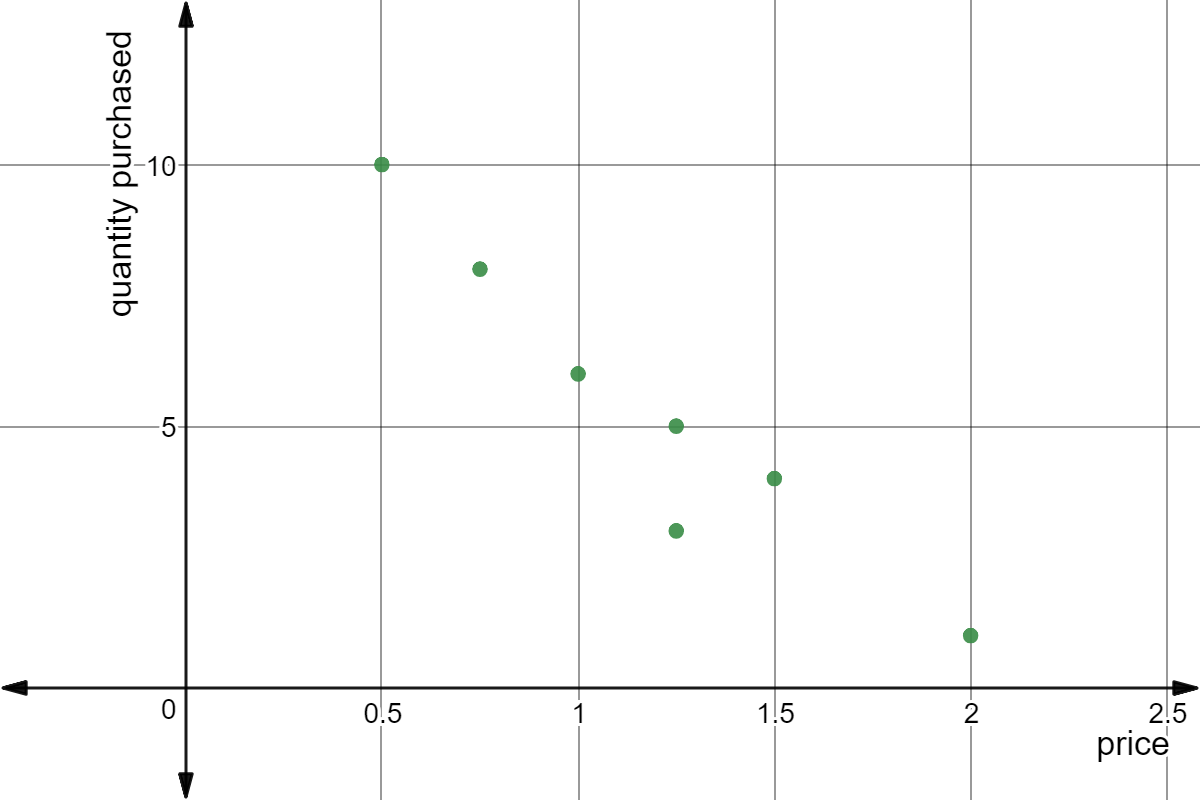
The following is a scatter plot representing the quantity of candy purchased at each price. At the -intercept, how much candy is sold?
Practice problem
Made using Desmos
The following is a scatter plot representing the quantity of candy purchased at each price. At the -intercept, how much candy is sold?