Practice problem
Scatter Plot Graph: How Correlated?
+1 contributors
Contributors

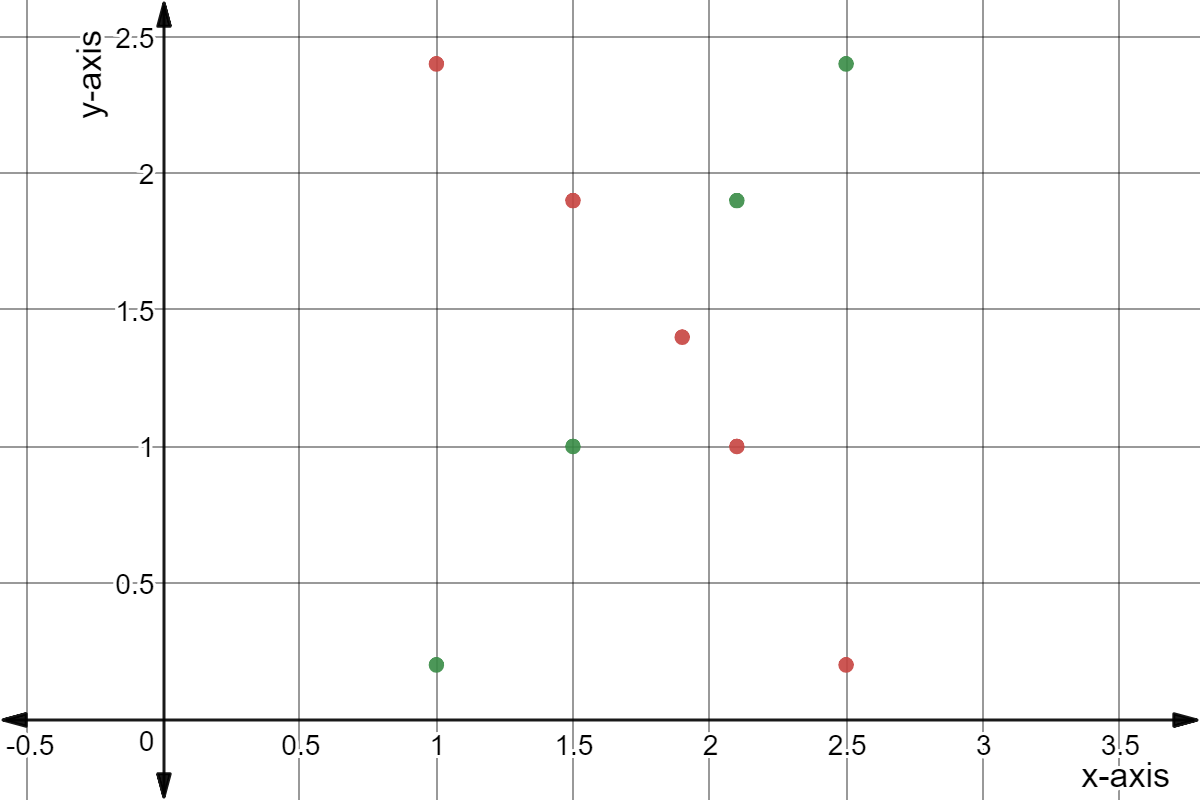
The scatter plot above represents two data sets. Match the data set with the corresponding color of points.
Practice problem
The scatter plot above represents two data sets. Match the data set with the corresponding color of points.