Practice problem
Residual Values - Definition & Examples
+2 contributors
Contributors

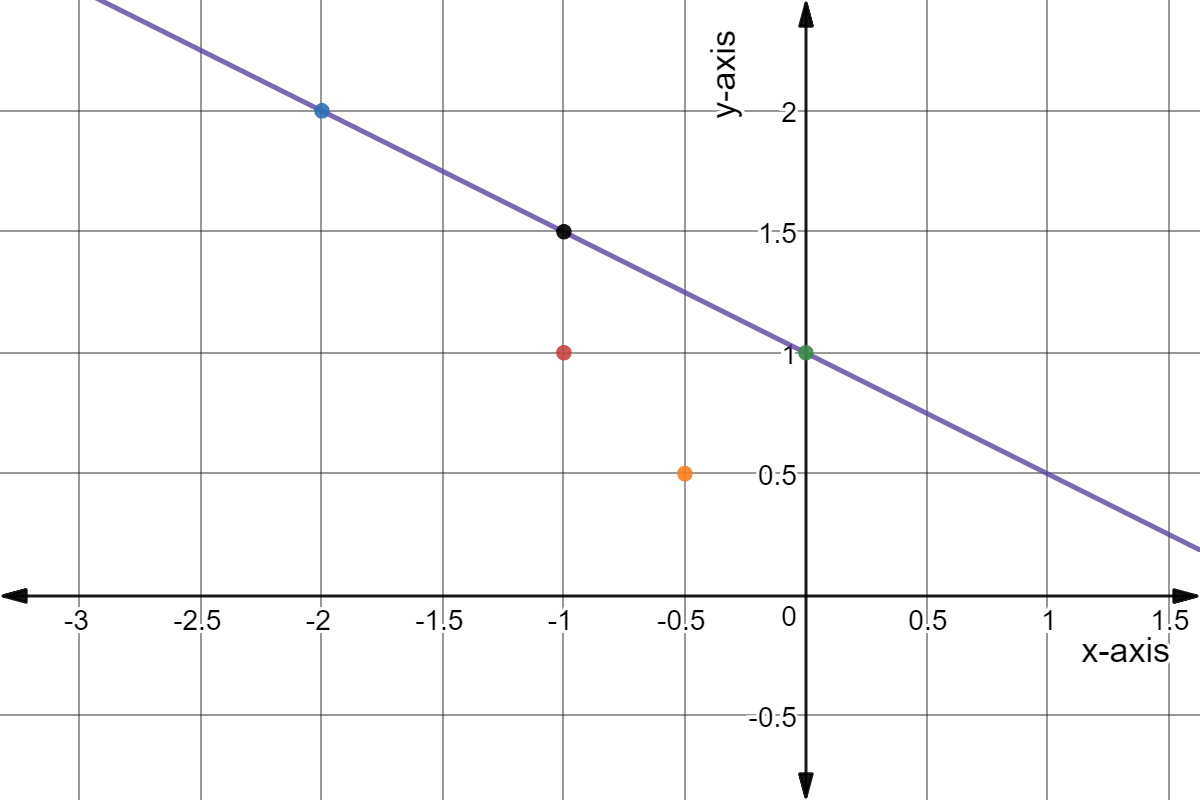
Consider the following graph, which color represents the actual point if the black point is the predicted value?
Practice problem
Consider the following graph, which color represents the actual point if the black point is the predicted value?