Practice problem
Trend Lines - Definition & Examples
+2 contributors
Contributors


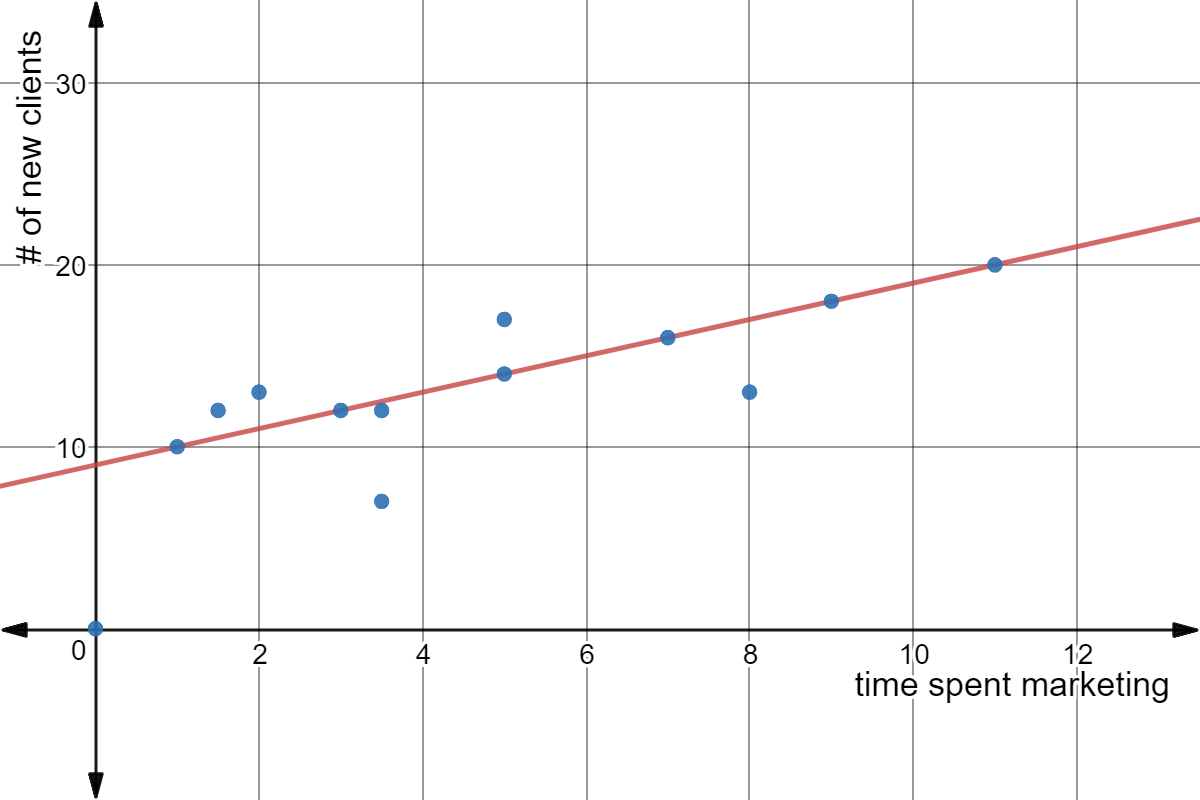
Made using Desmos
The graph above represents the relationship between the time a company spent on marketing and the number of new clients they received. A trend line has already been drawn with respect to the data. Based off the information given, which of the following is true?