Practice problem
Trend Lines - Definition & Examples
+2 contributors
Contributors


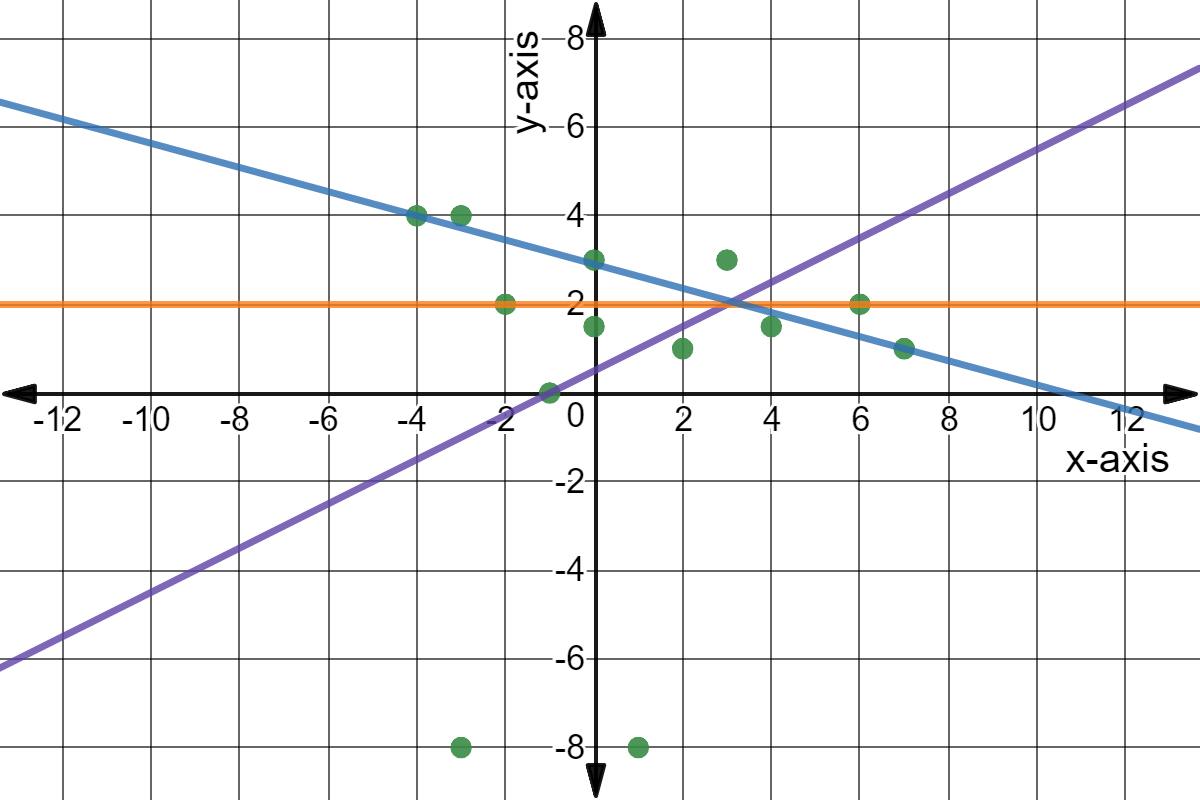
Made using Desmos
Which of the following represents a good trend line for the graph above?
Practice problem
Made using Desmos
Which of the following represents a good trend line for the graph above?