Practice problem
Trend Lines - Definition & Examples
+2 contributors
Contributors


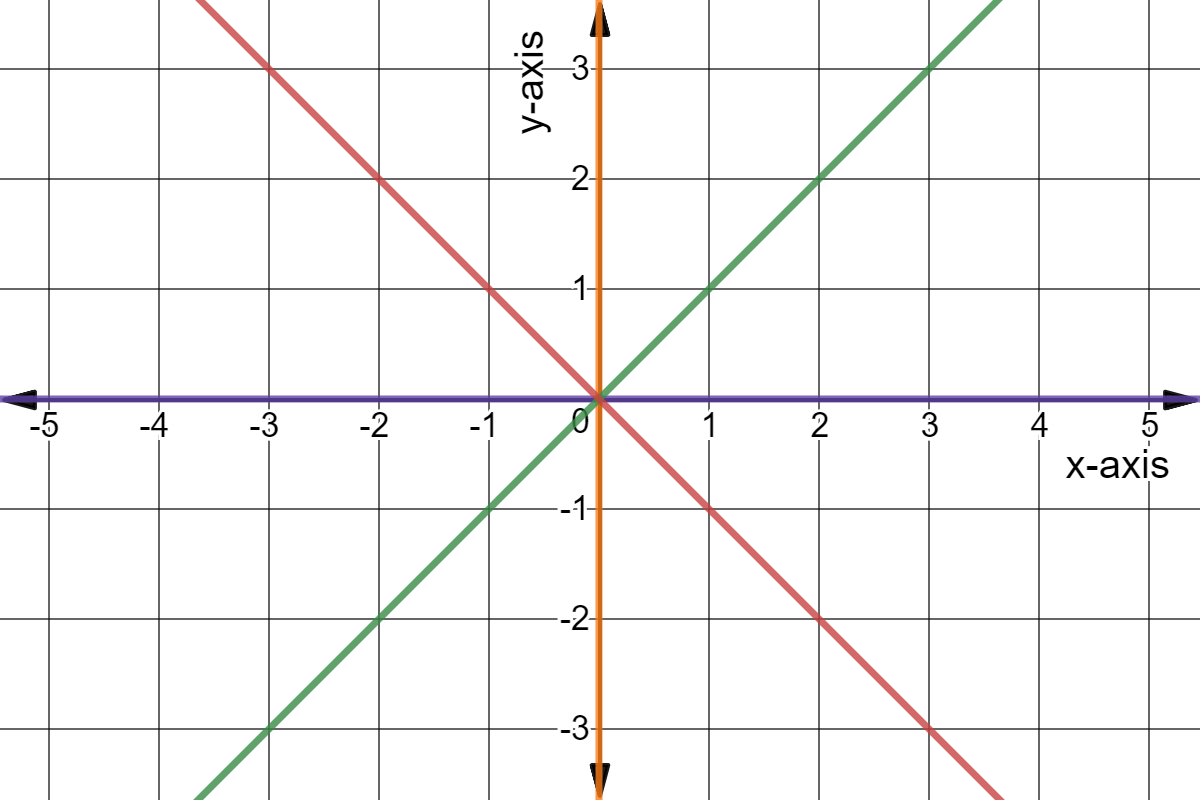
Made using Desmos
Data was collected from 6 college students, each drinking one more cup of coffee than the other. The study found that each participant stayed up an extra hour per cup of coffee they drank. Which line could be a line of best fit for the data?