Practice problem
Trend Lines - Definition & Examples
+3 contributors


Made using Desmos
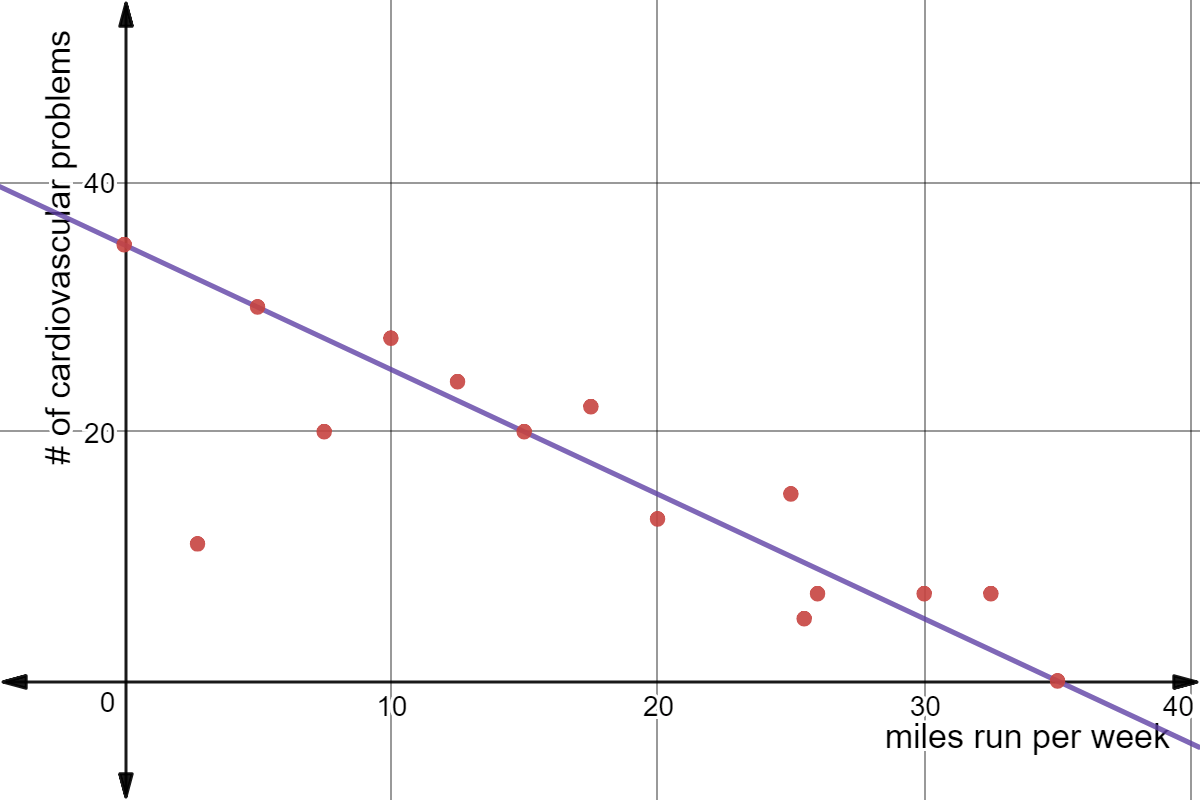
The scatter plot above shows the miles run per week and number of cardiovascular problems. What can we hypothesize based off this trend line?
Practice problem
Made using Desmos
The scatter plot above shows the miles run per week and number of cardiovascular problems. What can we hypothesize based off this trend line?