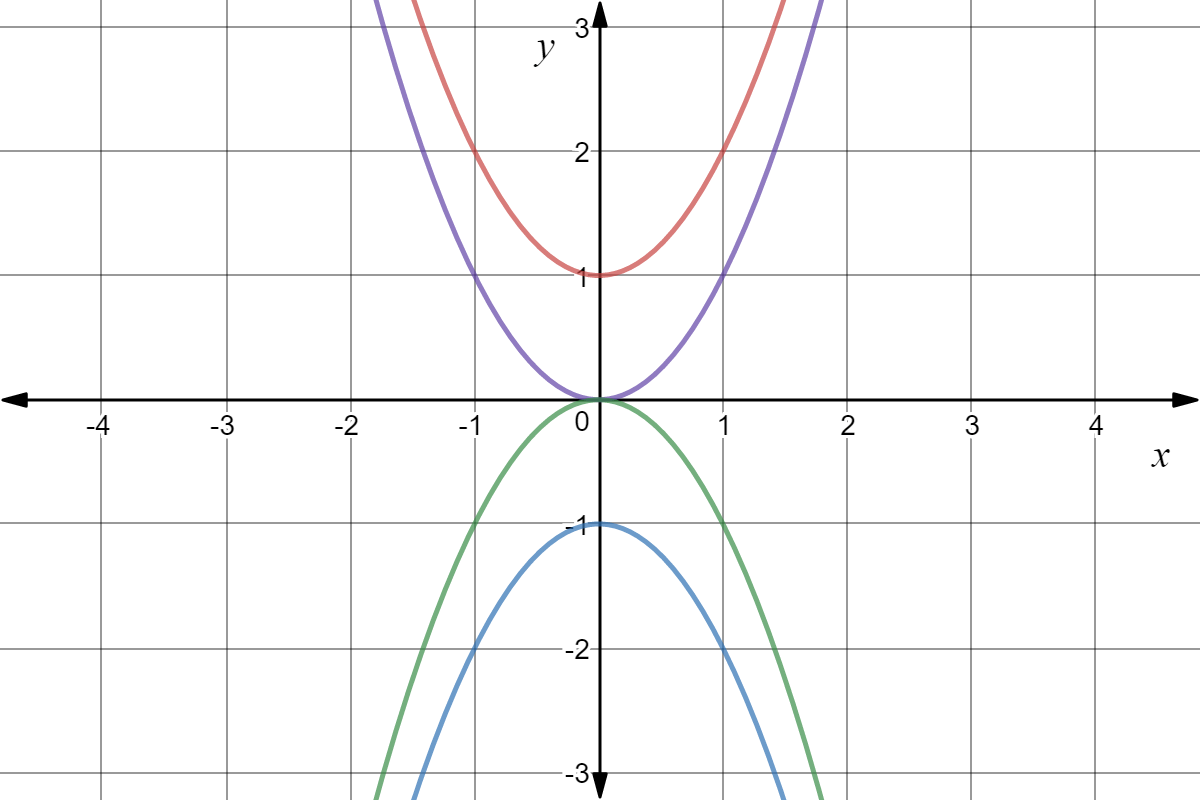
Reg graph: parabola that passes through (1,0)*, (1,2), (-1,2). Purple graph: parabola that passes through (0,0)*, (1,1), (-1,1). Green graph: parabola that passes through (0,0)*, (1,-1), (-1,-1). Blue graph: parabola passing through (-1,0)*, (-1,-2), (1,-2). Asterisks* indicate a vertex.

Made using Desmos

Which color curve represents the function f(x)=∣x2∣+1f\left(x\right)=\left|x^2\right|+1?

Choose one answer

Type a concept, like “slope” or “photosynthesis”.

↑ ↓ to choose · Enter to openSearch explanations and problems