Practice problem
What Is a Function Transformation?
+4 contributors



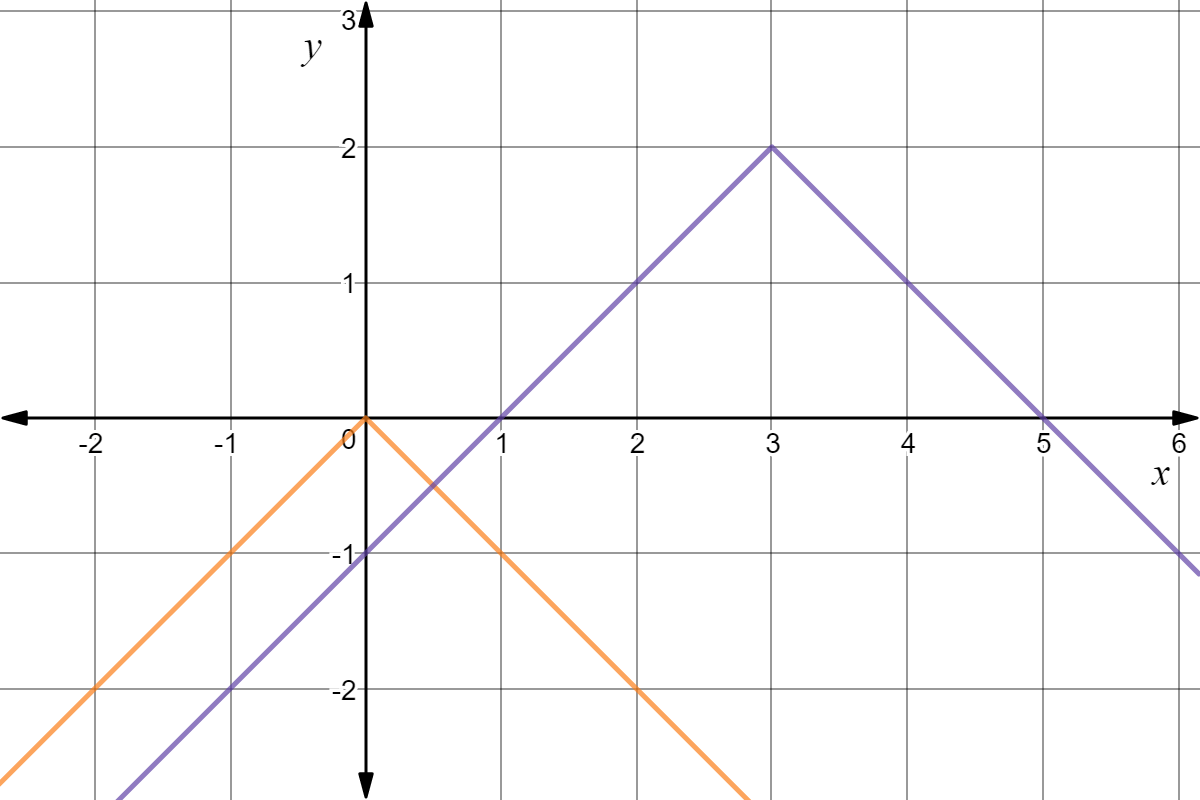
Made using Desmos
Consider the general form of the absolute value function . In the graph above, how do variables and change when moved from the orange function to the purple function?