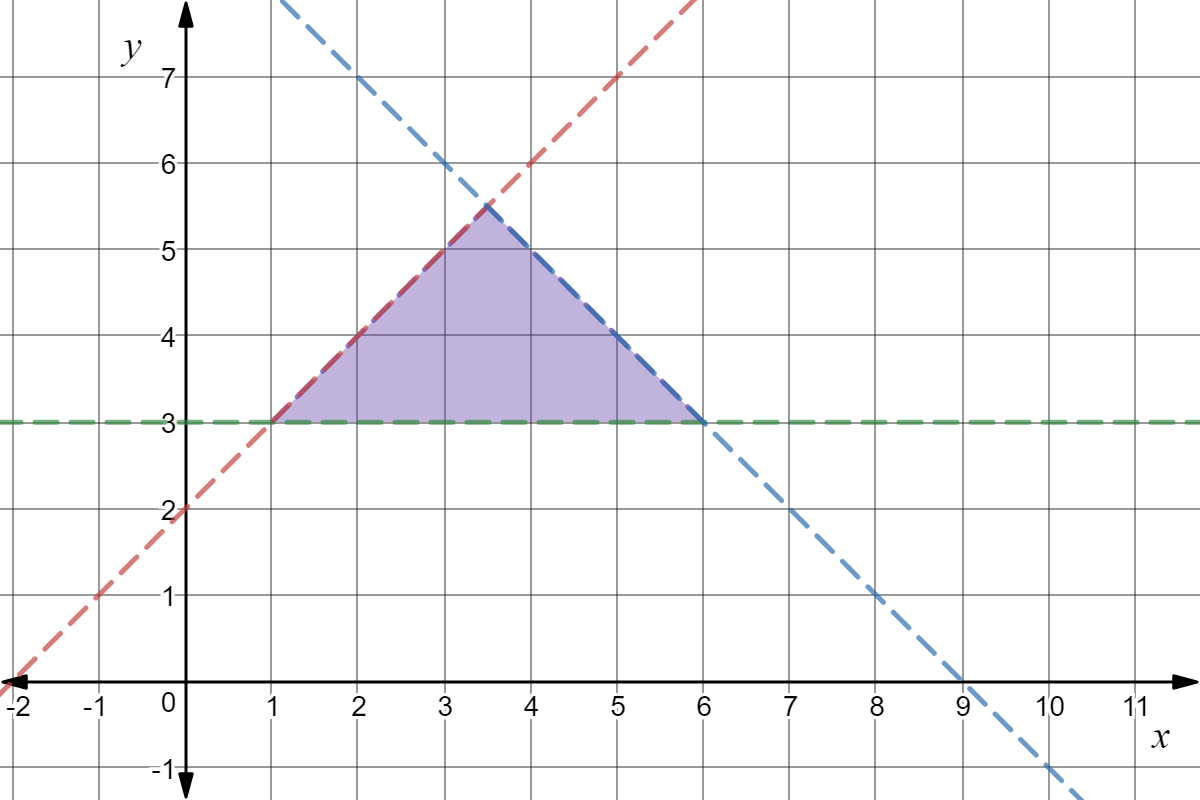
A graph of the upper right quadrant (positive) with 3 dotted lines.  The green line is at y = 3, the blue line is y = -x + 9 , and the red line y = x + 2.  The area above the green line, to the right of the red line, and to the left of the blue line is shaded purple.

Made using Desmos

Three linear inequalities are graphed above. Their common solution set is represented by the purple region. What are the three inequalities in the system?

Choose one answer

Type a concept, like “slope” or “photosynthesis”.

↑ ↓ to choose · Enter to openSearch explanations and problems