Practice problem
Graphing Systems of Linear Inequalities - Process & Examples
+4 contributors



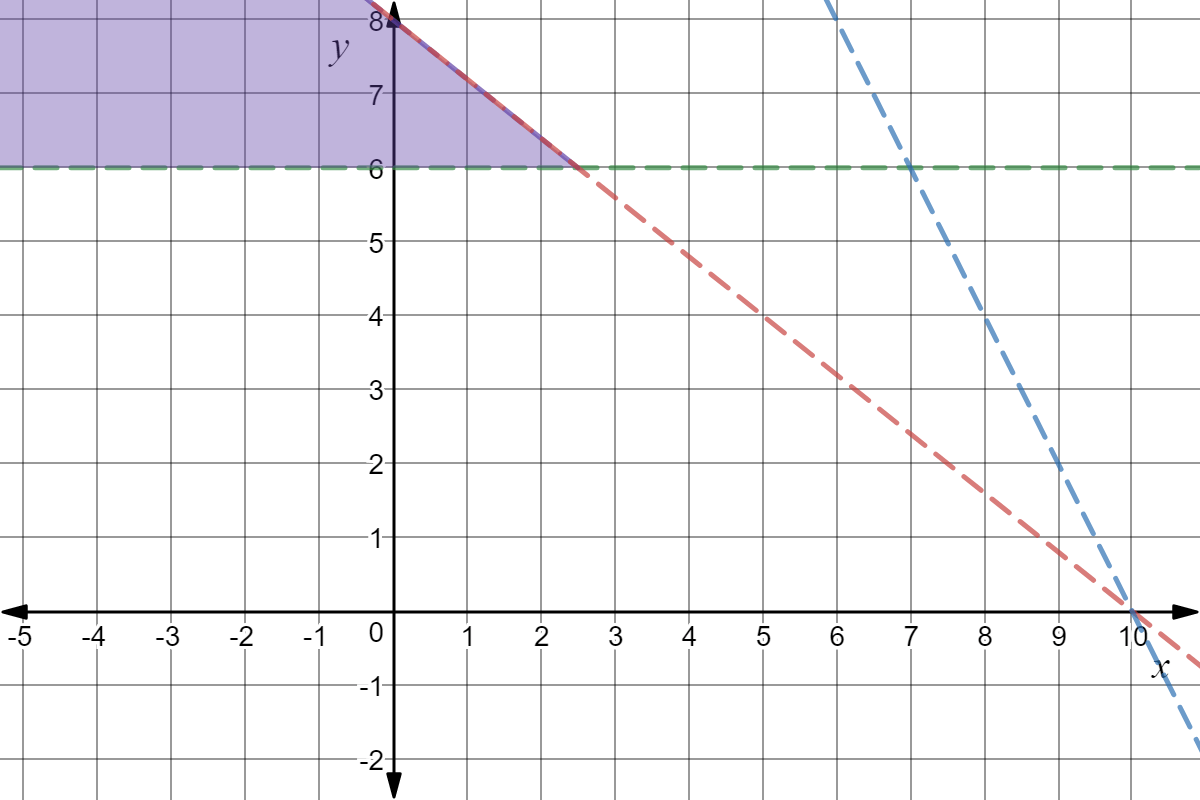
Made using Desmos
The graph of a system of linear inequalities is shown above. What is the description of the solution set?
Practice problem
Made using Desmos
The graph of a system of linear inequalities is shown above. What is the description of the solution set?