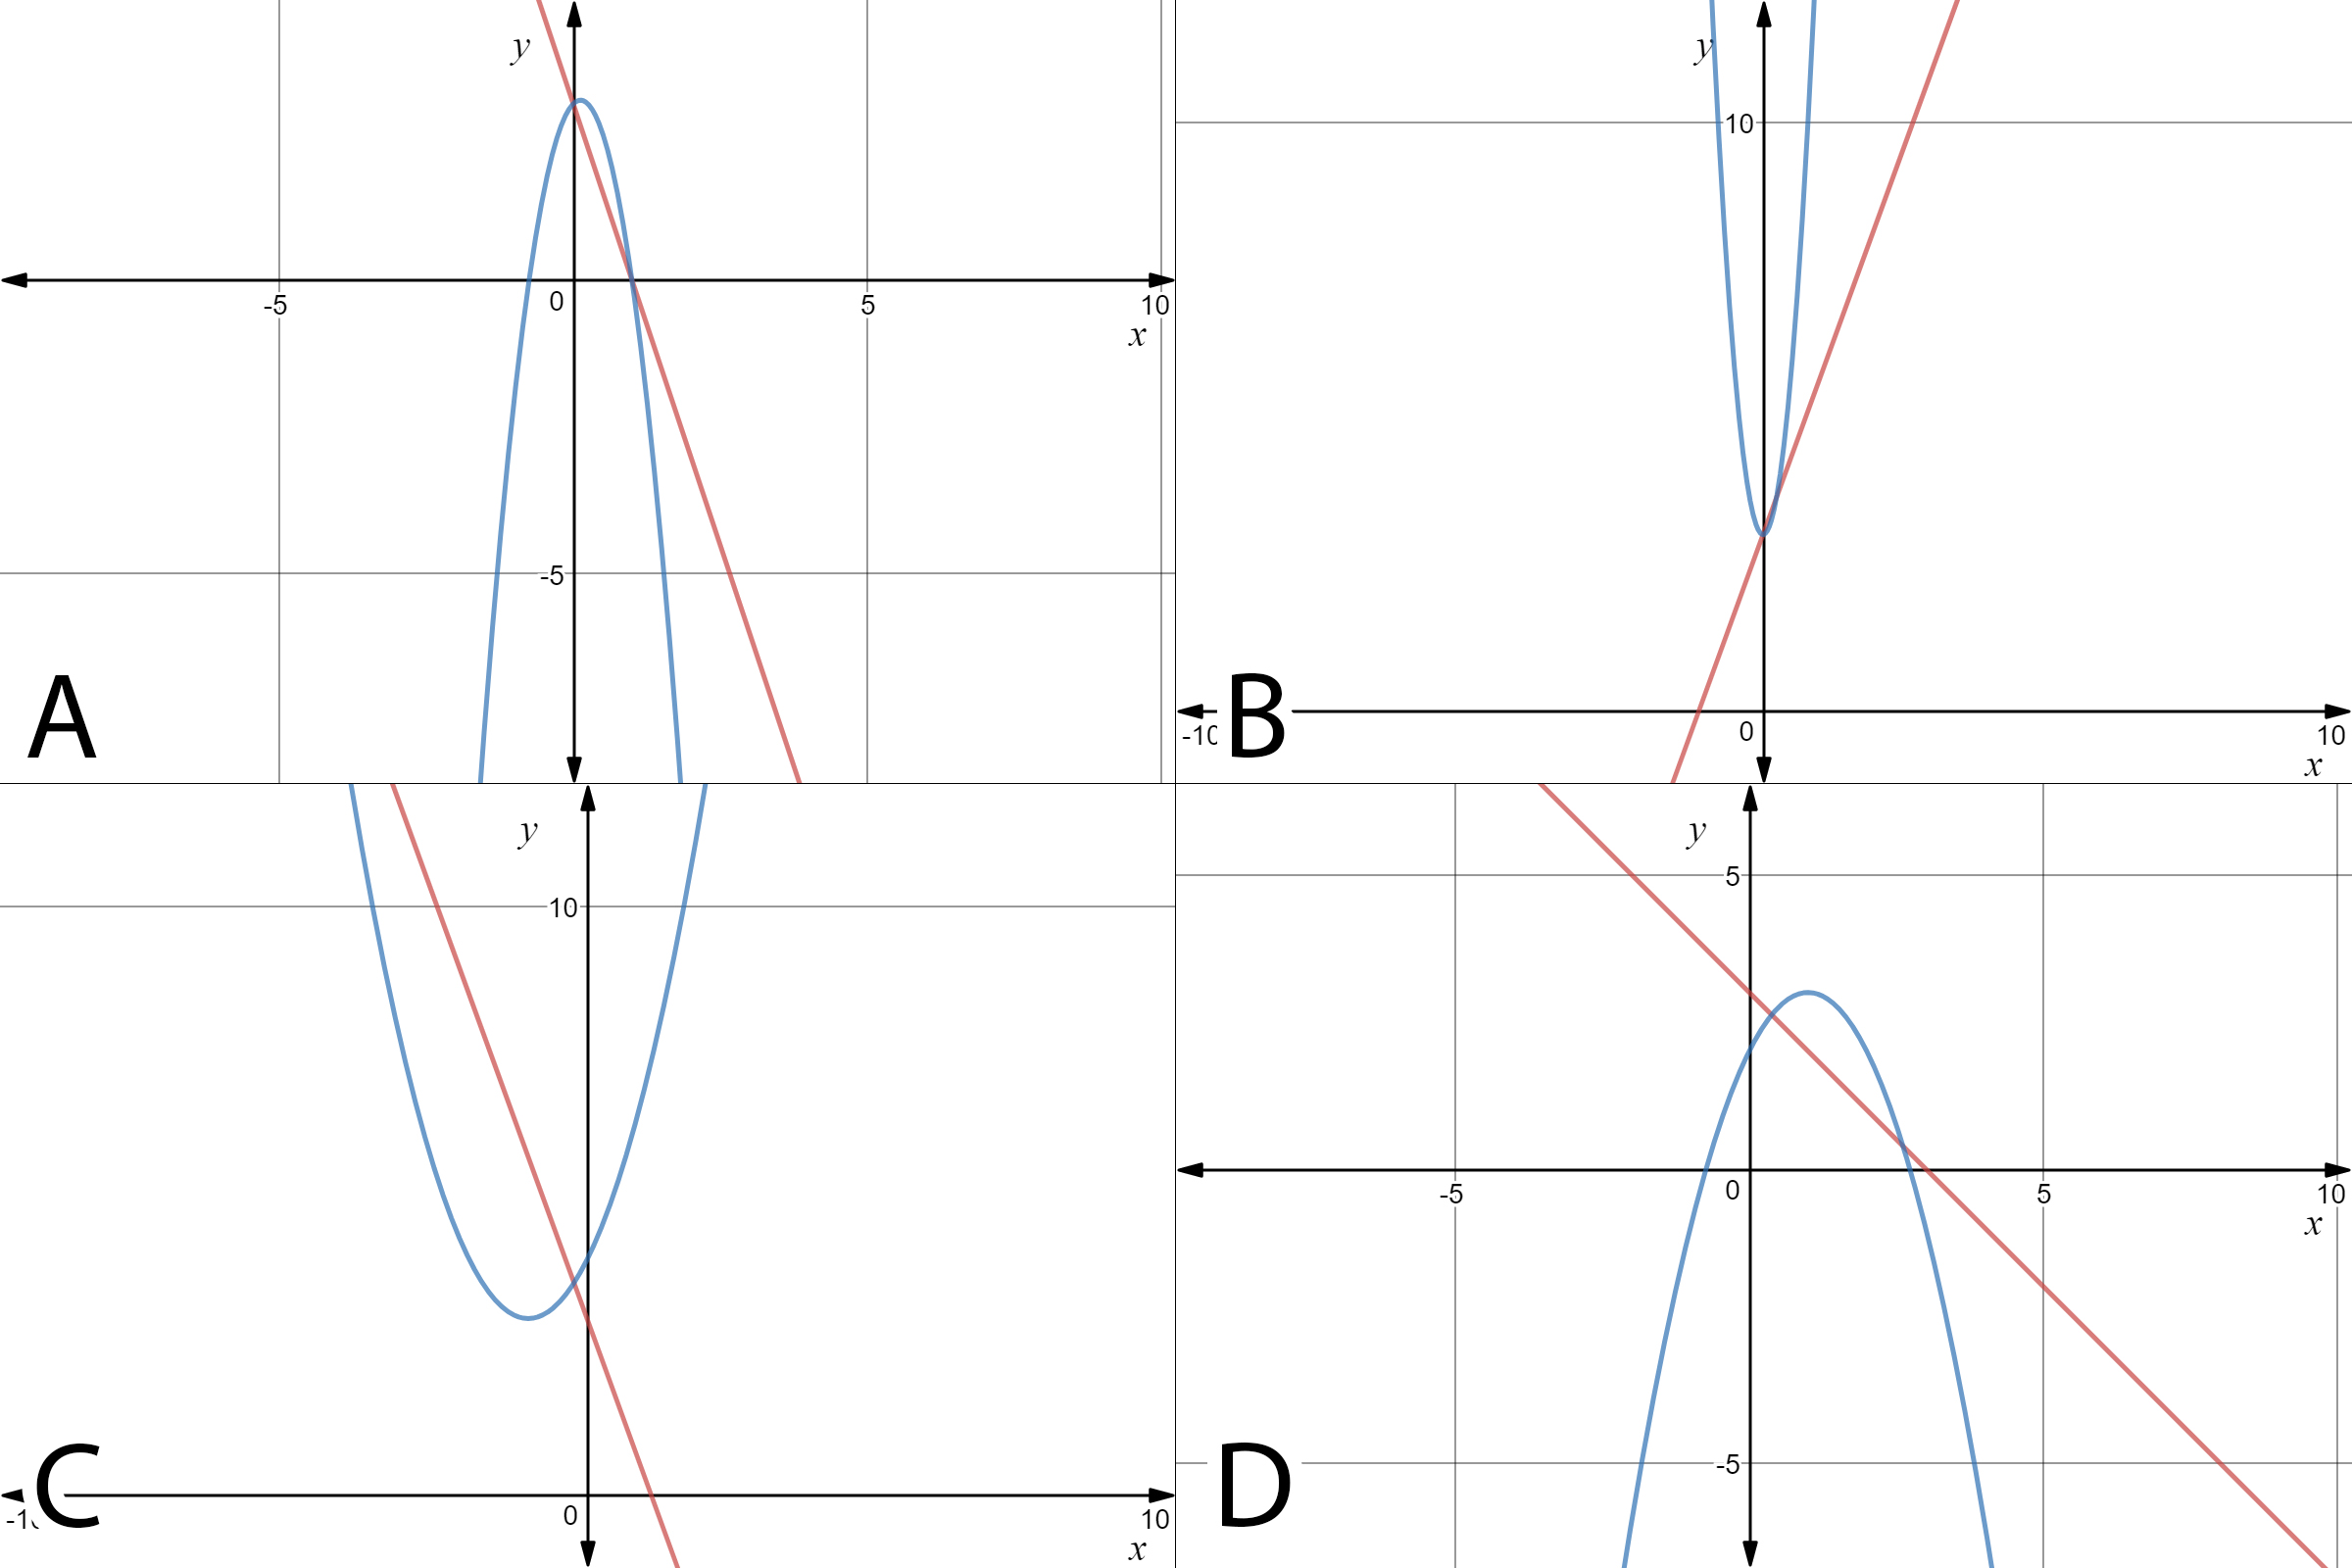
Graph A: parabola opening downwards with vertex at (0.125, 3.063), x-intercepts at (-0.175, 0) and (1, 0), and a y-intercept at (0, 3); a line with a slope of -3 and a y-intercept at (0, 3). Graph B: parabola opening upwards with a vertex at (0, 3); a line with a slope of 3 and a y-intercept at (0, 3). Graph C: parabola opening upwards with vertex at (-1, 3) and a y-intercept at (0, 4); a line with a slope of -3 and a y-intercept at (0, 3). Graph D: parabola opening downwards with vertex around (3, 1), a y-intercept around (0, 2), and x-intercepts around (-1, 0) and (-.75, 0); a line with a slope of -3 and a y-intercept at (0, 3).

Graphs created on Desmos

Which graph represents the following system of equations: {y=−4x2+x+3y=−3x+3\begin{cases} y=-4x^2+x+3\\ y=-3x+3 \end{cases}

Choose one answer

Type a concept, like “slope” or “photosynthesis”.

↑ ↓ to choose · Enter to openSearch explanations and problems