Practice problem
What Is a Histogram?
+3 contributors



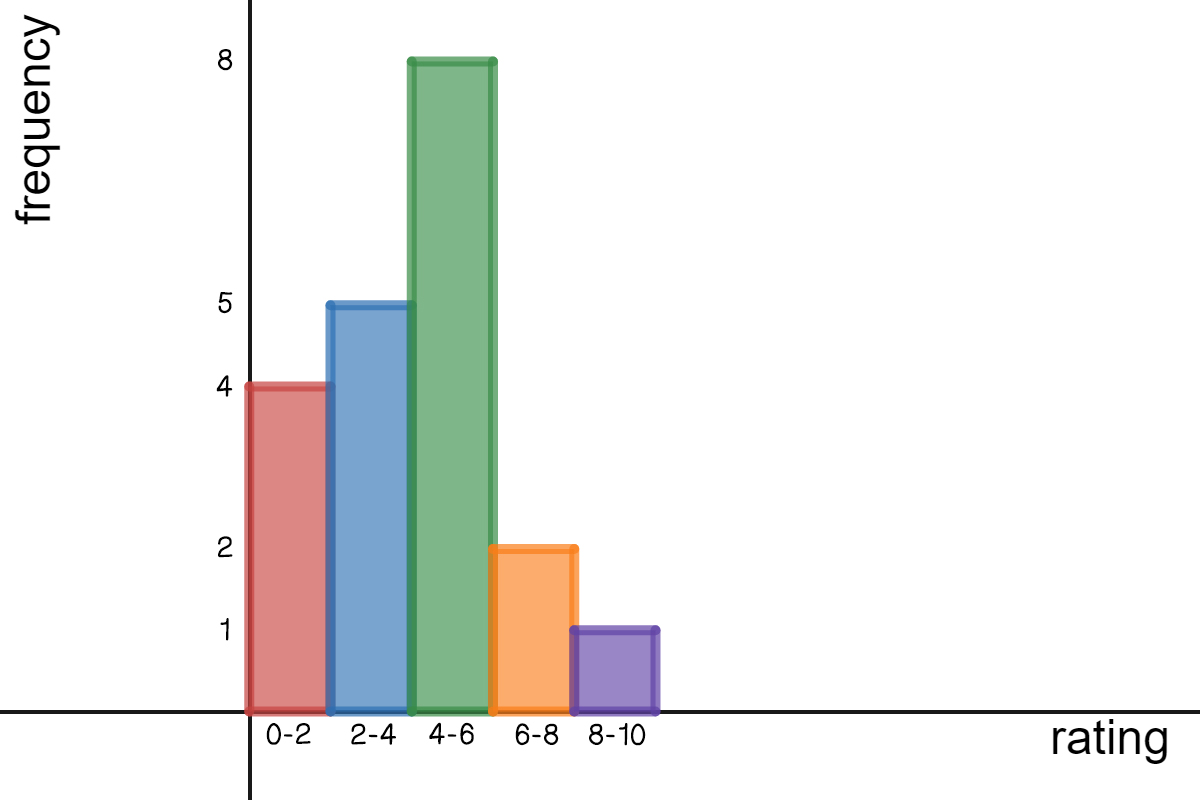
Made using Desmos
Doctors at the expii hospital are testing out a new pain relieving medicine. They asked of their patients to rate their pain on a scale from after taking the new pain reliever. The histogram above represents this data.
What is the minimum number of patients that could have experienced a rating above ?