Practice problem
What Is a Histogram?
+3 contributors



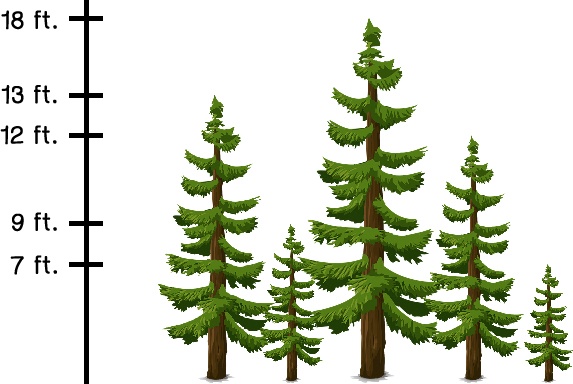

Consider the following trees. If the intervals used are , , and , which histogram correctly represents these measurements?
Practice problem
Consider the following trees. If the intervals used are , , and , which histogram correctly represents these measurements?