Practice problem
Measures of Central Tendency: Mode
+2 contributors
Contributors


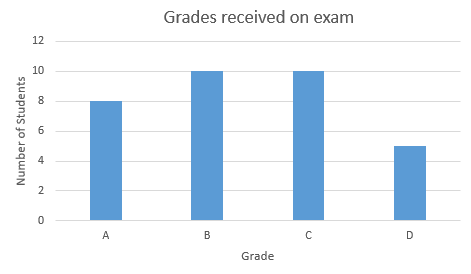
Image Source: Victoria Rodriguez
Made with Microsoft Excel
A math class was given an exam, the grades are recorded in the graph above. What is the mode?
Practice problem
Image Source: Victoria Rodriguez
Made with Microsoft Excel
A math class was given an exam, the grades are recorded in the graph above. What is the mode?