Practice problem
Word Problems: When to Use Mean, Median, and Mode
+1 contributors
Contributors

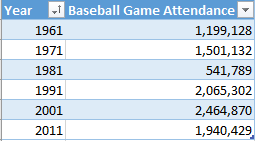
The above table lists the average baseball game attendance for the Pittsburgh Pirates for the years . The owners of the team want to know the average attendance over this fifty year span in order to predict future game attendance. Given the data above what measure of central tendency will best represent this data?