Practice problem
Measures of Central Tendency: Mean
+2 contributors
Contributors


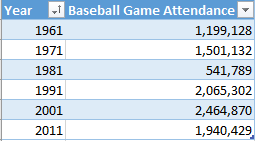
Image Source: Victoria Rodriguez
Given the data set above, which year should be excluded when calculating a mean that is representative of the data?
Practice problem
Image Source: Victoria Rodriguez
Given the data set above, which year should be excluded when calculating a mean that is representative of the data?