Practice problem
Statistics: Frequency Distributions
+3 contributors



Made using Desmos
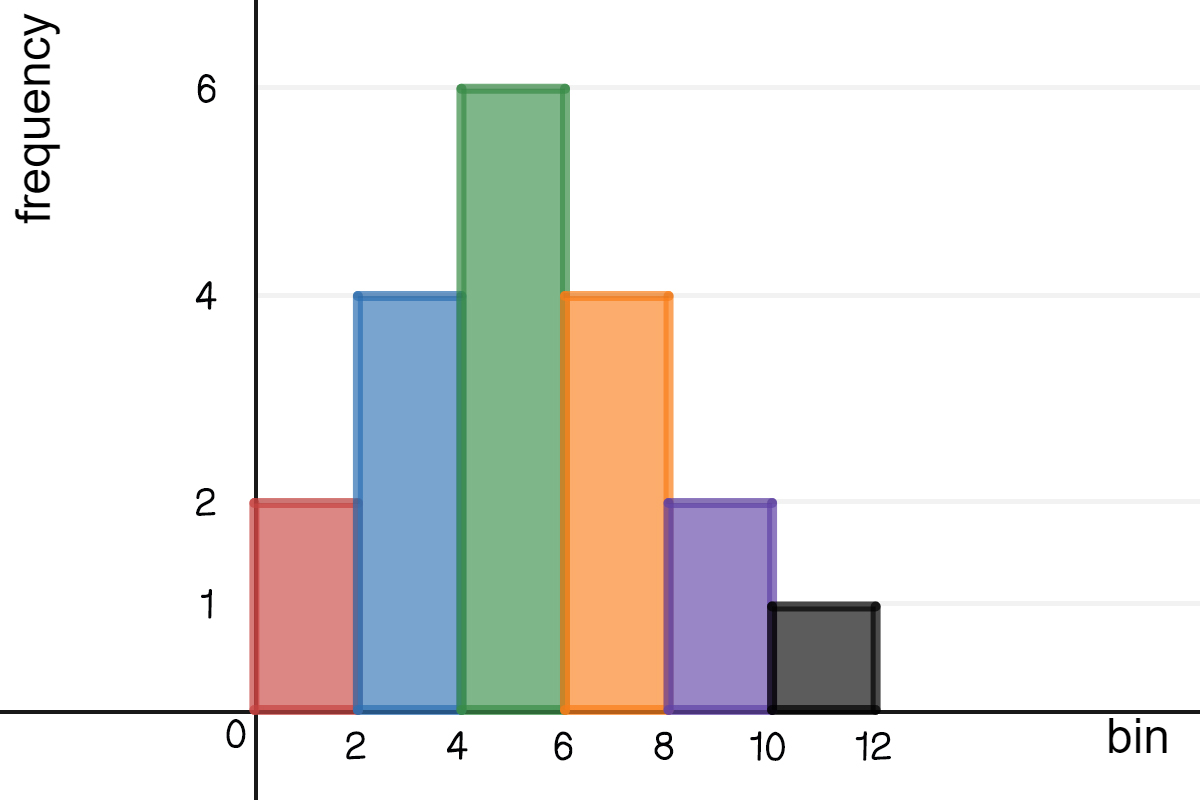
Which of the following frequency distribution charts represents the histogram above?
Practice problem
Made using Desmos
Which of the following frequency distribution charts represents the histogram above?