Practice problem
Statistics: Frequency Distributions
+3 contributors



Made using Desmos
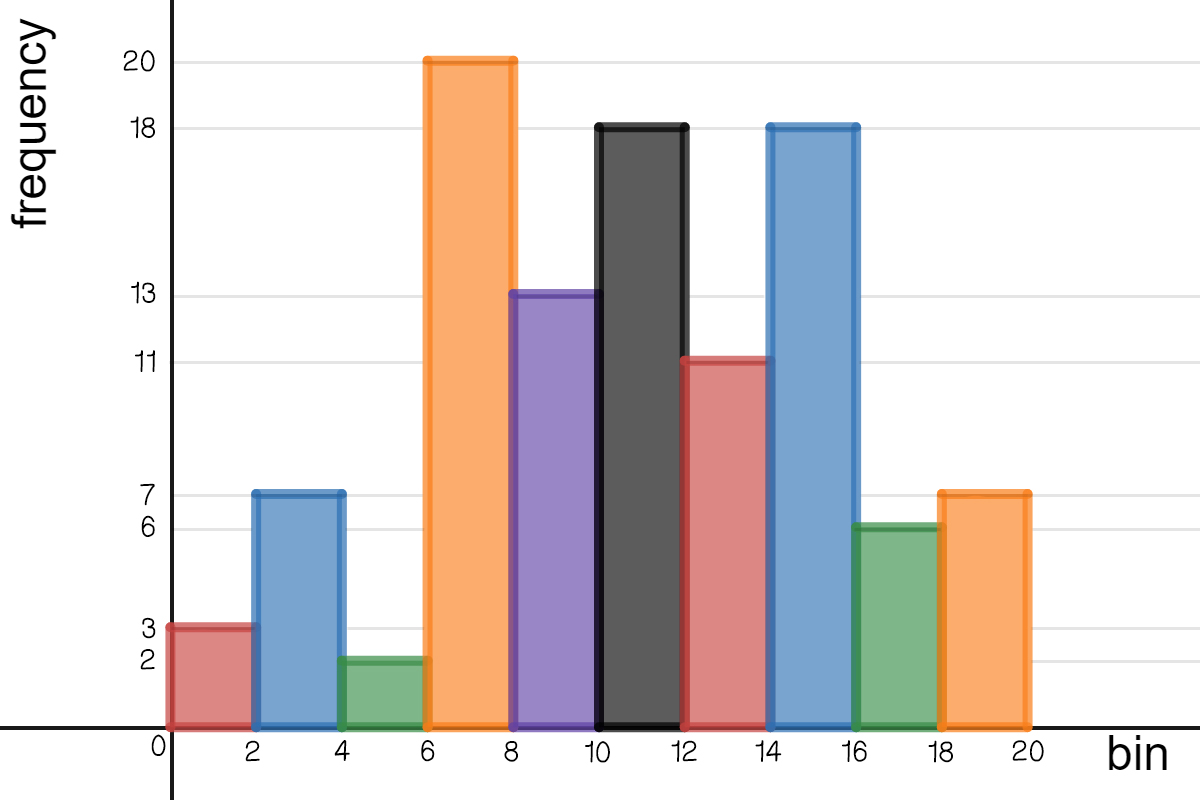
How many peaks does the following frequency distribution chart have?
Practice problem
Made using Desmos
How many peaks does the following frequency distribution chart have?