Practice problem
Made using Desmos
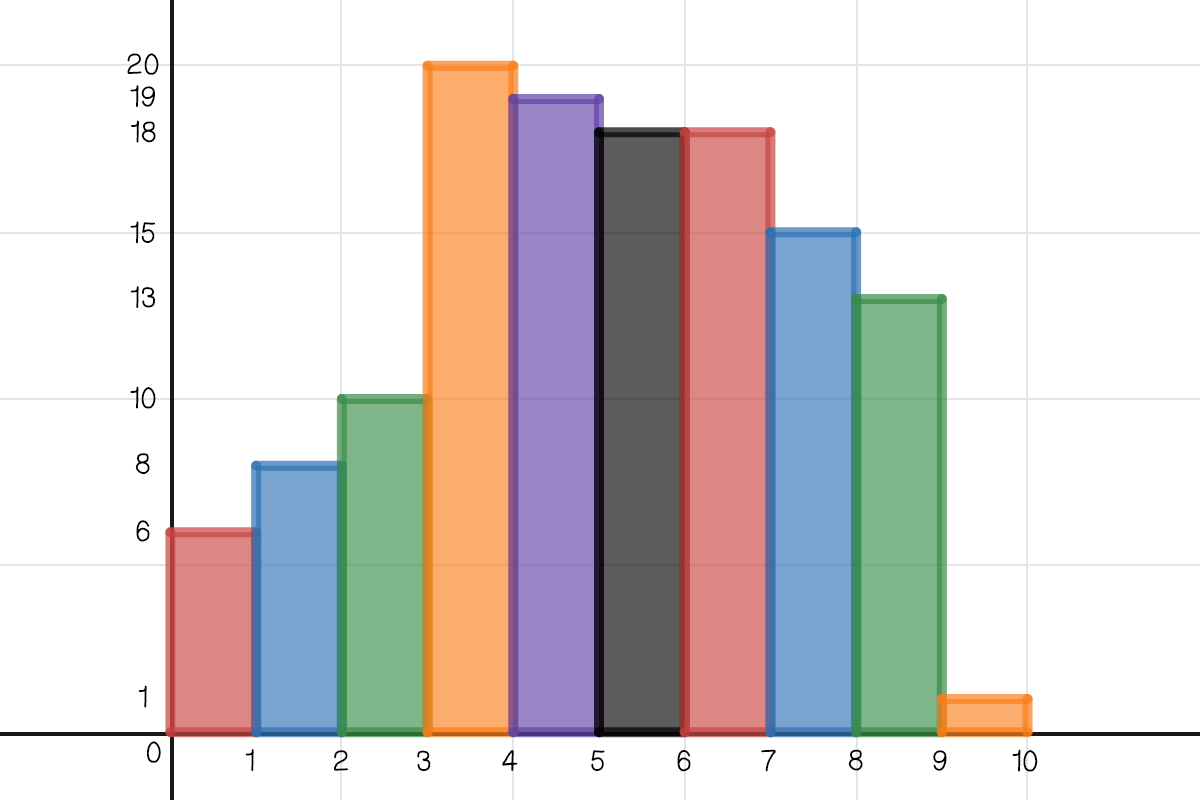
What is the outlier in the following frequency distribution chart?
5-65\text{-}65-6
9-109\text{-}109-10
2-32\text{-}32-3
7-87\text{-}87-8
Type a concept, like “slope” or “photosynthesis”.