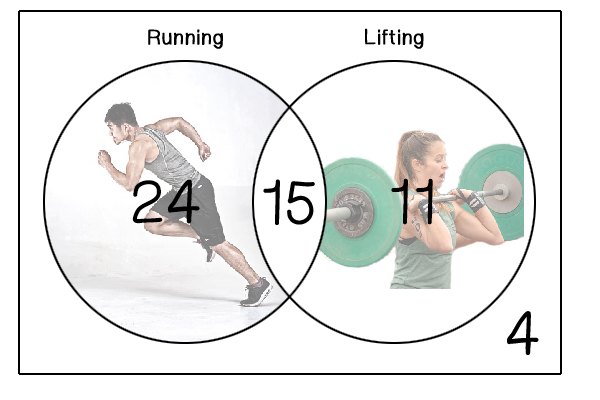
A Venn diagram. Running has 24. Lifting has 11. Both is 15. Neither is 4.

Image Sources:

Runner by geniusvv via Pixabay (License)

Lifter by Frans Van Heerden via Pexels (License)

Random people were surveyed at the Expii gym and asked whether or not they run or lift more. The data was recorded in the Venn diagram above. RunsDoesn’t RunTotalLiftsDoesn’t LiftTotals\begin{array}{|c|c|c|c|} \hline &\text{Runs}&\text{Doesn't Run}&\text{Total}\\ \hline \text{Lifts}&&&\\ \hline \text{Doesn't Lift}&&&\\ \hline \text{Totals}&&&\\ \hline \end{array}

Based off the Venn diagram, fill in the cumulative frequency table and determine how many people were surveyed in total.

Choose one answer

Type a concept, like “slope” or “photosynthesis”.

↑ ↓ to choose · Enter to openSearch explanations and problems