Practice problem
Climate Change — Overview & Effects
By Deena Hauze

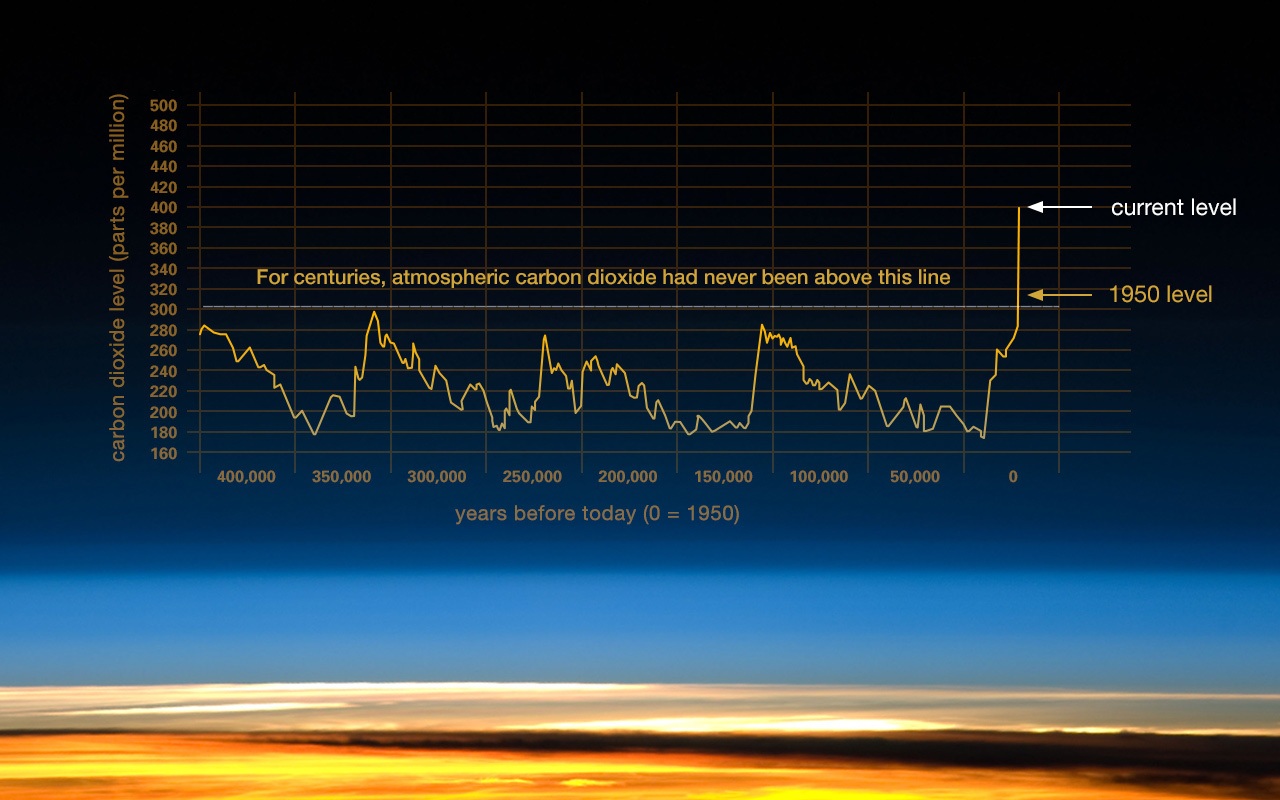
Carbon dioxide concentration change from NASA's website.
Image source: nasa.gov
Interpret the data: How many more parts per million of carbon dioxide are there now compared to 1950?
Practice problem
Carbon dioxide concentration change from NASA's website.
Image source: nasa.gov
Interpret the data: How many more parts per million of carbon dioxide are there now compared to 1950?