Practice problem
Carrying Capacity — Definition & Overview
By Deena Hauze

+1 contributors
Contributors
Bigmadrich CC BY-SA 3.0
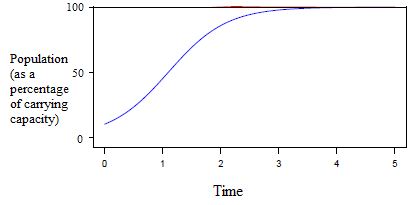
Examine the graph. The population is at 100%, so what will happen next?
Practice problem
Bigmadrich CC BY-SA 3.0
Examine the graph. The population is at 100%, so what will happen next?