Practice problem
Deactivation of Enzymes — Overview & Examples
+1 contributors
Contributors

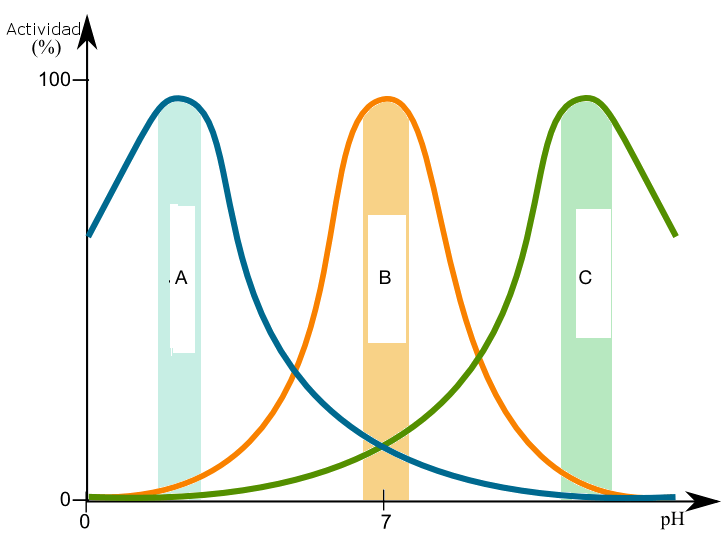
Image Source: By Alejandro Porto CC BY-SA 3.0, via Wikimedia Commons

Which of these lines most likely represents the activity of an enzyme located in the stomach?