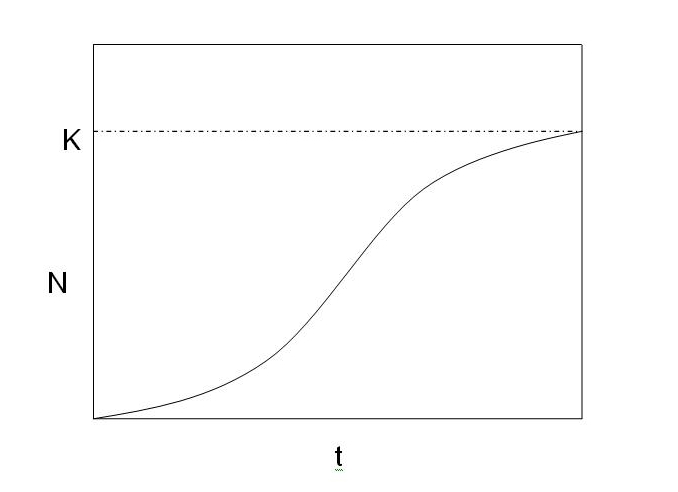
The y-axis is labeled N, the x-axis is labeled t, and there is a horizontal line labeled K. The graph starts at zero and increases quickly.  It slows down near the line labeled K and stays just below that horizontal line.

Cephas CC BY-SA 3.0

In this graph what factor does N represent?

Choose one answer

Type a concept, like “slope” or “photosynthesis”.

↑ ↓ to choose · Enter to openSearch explanations and problems