Practice problem
Estimate Value of a Function - Examples & Practice
+5 contributors




Kayla's organization is selling sandwiches for a fundraiser. They had a stand set up for hours. Throughout the day, people took notes on how many sandwiches the organization sold every hour.
Take a look at the graph below.
The -values are hours—for example, when , the organization has been selling for an hour. The -values are the amount of sandwiches the organization sold that hour.
For example, they sold roughly sandwiches the second hour, since when , .
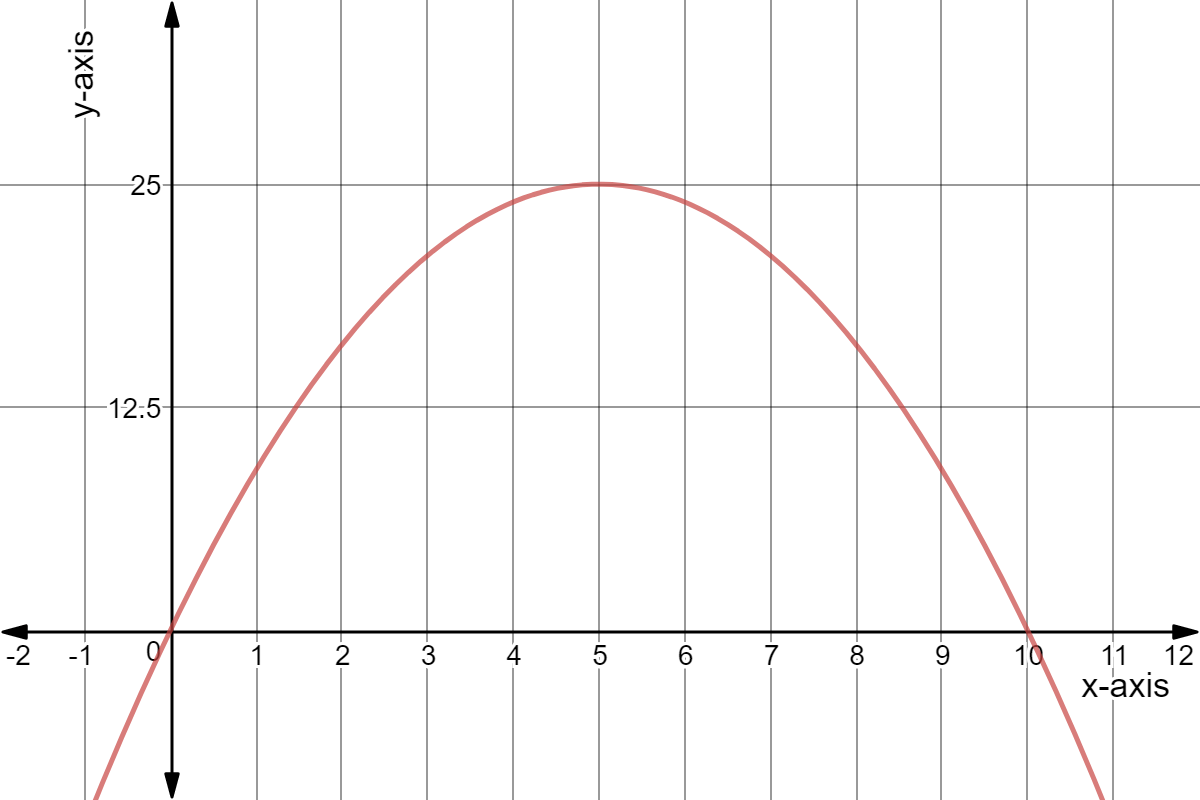
Made using Desmos
When did they sell the most amount of sandwiches?