Practice problem
Temperature (Enzyme Reaction Rates) — Effects & Examples
+2 contributors
Contributors


The graph pictured below shows an enzyme's optimal temperature in which it will operate best.
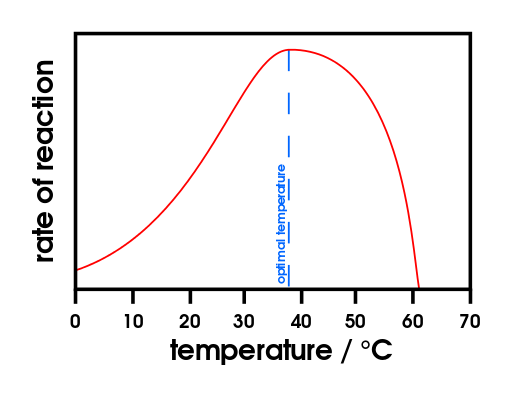
Image Source: By domdomegg (Own work) CC BY 4.0, via Wikimedia Commons

What will likely happen if this enzyme is placed in an environment where the temperature reaches 60 C?