Practice problem
Catalysts (Enzymes) — Overview & Examples
+1 contributors
Contributors

The relative rate of Reaction X can be inferred from the graph below. The product of Reaction X is carbon dioxide (). The volume of produced is shown on the y-axis.
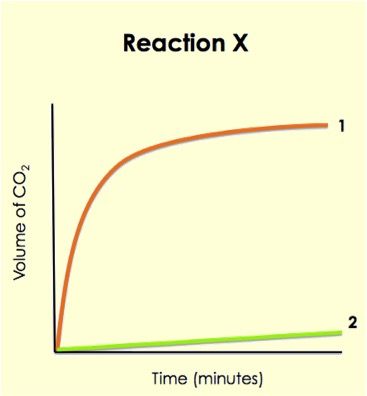
The graph above shows two different versions of Reaction X - with a catalyst and without a catalyst. Which curve (1 or 2) shows Reaction X when a catalyst is present?