Practice problem
Rate of Reaction (Enzymes) — Role & Importance
+1 contributors
Contributors

The graph below shows changes in the rate of reaction as substrate concentration is increased. The flat portion of the curve, labeled plateau, indicates a period of no change in reaction rate despite increases in substrate.
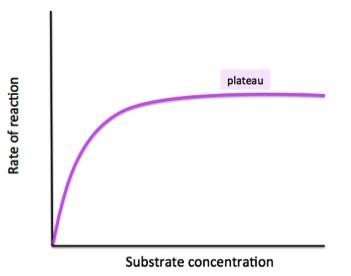
Which of the choices below best explains why the rate of reaction eventually stops increasing even when more substrate is added?