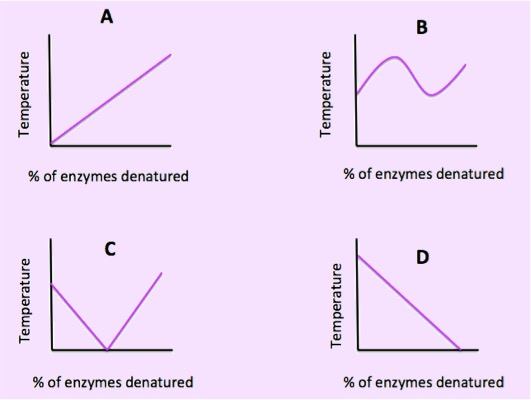
In graph A, the rate of reaction continuously increases as the enzyme concentration increases. In graph B, the rate of reaction fluctuates between increasing and decreasing as enzyme concentration is increased. In graph C, as the concentration of enzymes increases, the rate of reaction first decreases steadily to zero, and then starts increasing steadily. In graph D, the rate of reaction steadily decreases as the enzyme concentration increases.

Which of the graphs above correctly shows the relationship between increasing temperature and denaturation of enzymes?

Choose one answer

Type a concept, like “slope” or “photosynthesis”.

↑ ↓ to choose · Enter to openSearch explanations and problems