Practice problem
Concentration (Enzyme Reaction Rates) — Effects & Role
+1 contributors
Contributors

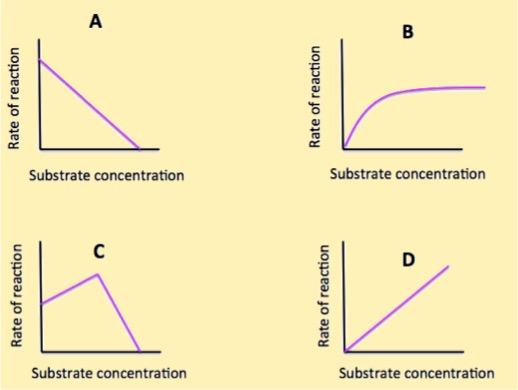
Which of the graphs above correctly shows the relationship between substrate concentration and rate of reaction?
Practice problem
Which of the graphs above correctly shows the relationship between substrate concentration and rate of reaction?