Practice problem
Discrete Data - Defintion & Examples
+3 contributors
Contributors


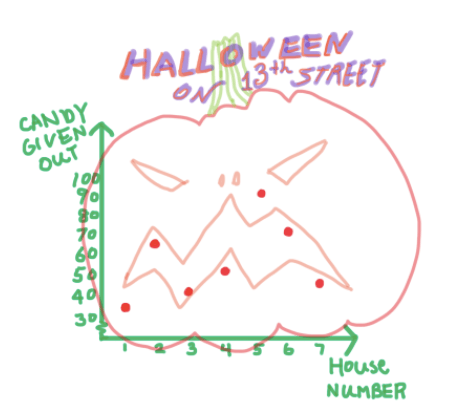
Image source: by Christine
The graph above records the amount of candy given out by a couple of houses on 13th street. What kind of graph is this?
Practice problem
Image source: by Christine
The graph above records the amount of candy given out by a couple of houses on 13th street. What kind of graph is this?