Practice problem
What Is the Range of a Function?
+3 contributors
Contributors

By Christine
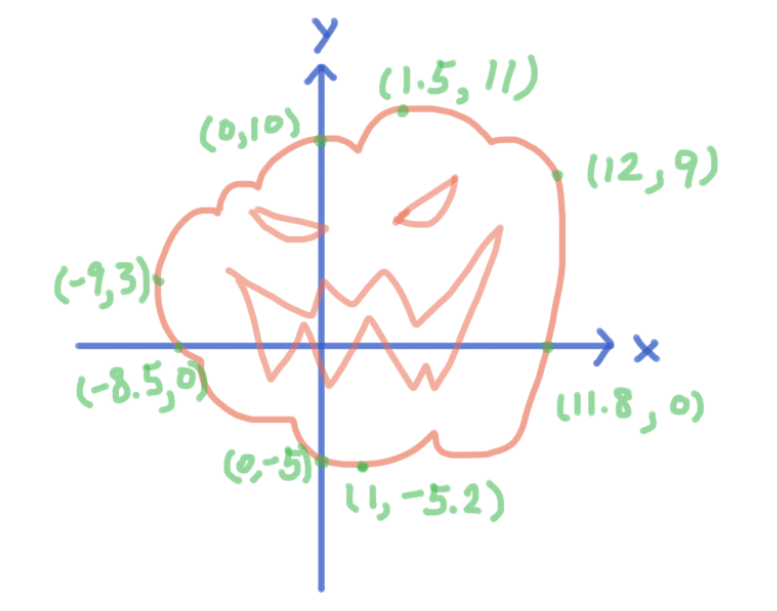
Above is the graph of a evil pumpkin, with extra coordinates trying to scare people off. What is the range of this pumpkin?
Practice problem
By Christine
Above is the graph of a evil pumpkin, with extra coordinates trying to scare people off. What is the range of this pumpkin?