Practice problem
Catalyst Regulating Reactions — Overview & Examples
+1 contributors
Contributors

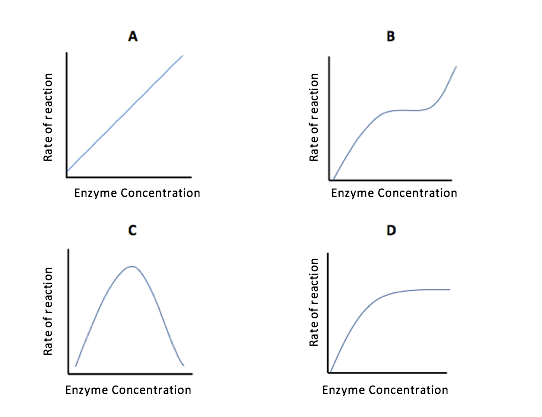
Which of the graphs pictured above represents the rate of the reaction with unlimited substrate and unlimited enzyme?
Practice problem
Which of the graphs pictured above represents the rate of the reaction with unlimited substrate and unlimited enzyme?