Practice problem
Catalyst Regulating Reactions — Overview & Examples
+1 contributors
Contributors

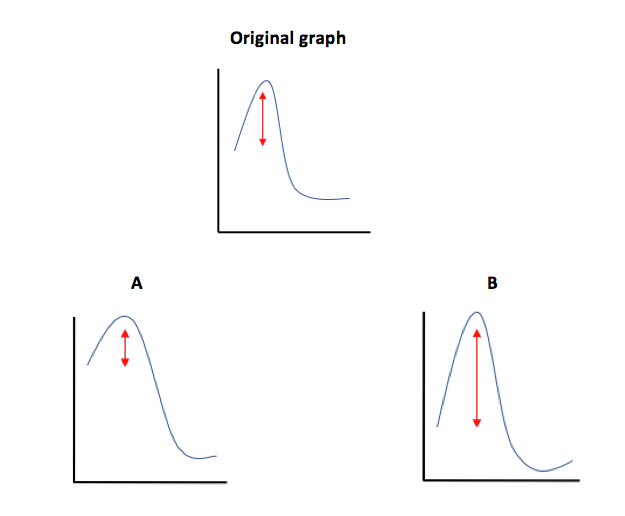
Which graph represents the addition of an enzyme from the original graph?
Practice problem
Which graph represents the addition of an enzyme from the original graph?