Practice problem
Left, Right, and Midpoint Riemann Sums
+4 contributors

I'm looking at this increasing function:
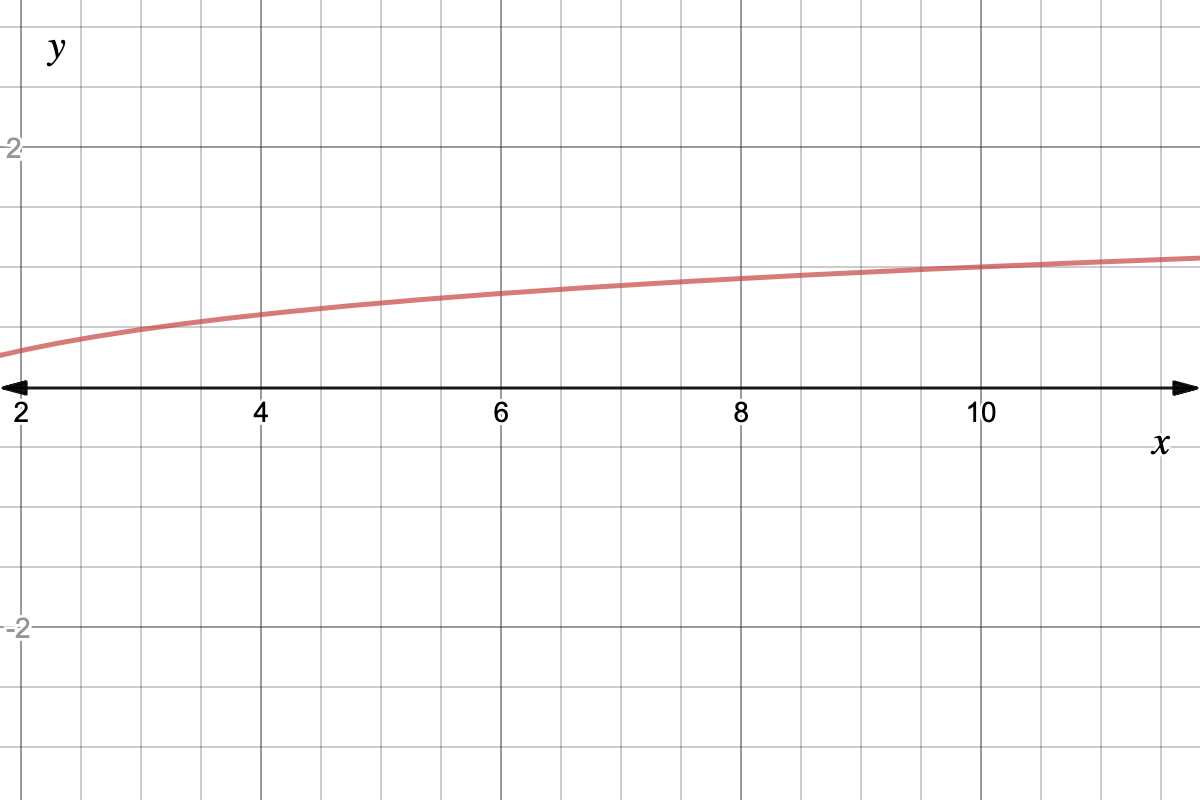
Graph courtesy of Desmos
Let's think about the Riemann sums in the interval between and , with 38 rectangles.
I wonder how the corresponding Left, Right, and Midpoint Riemann sums compare in size.
Order the Left, Right, and Midpoint Riemann sums from smallest to largest.