Practice problem
What Are Logarithmic Scales?
+2 contributors
Contributors


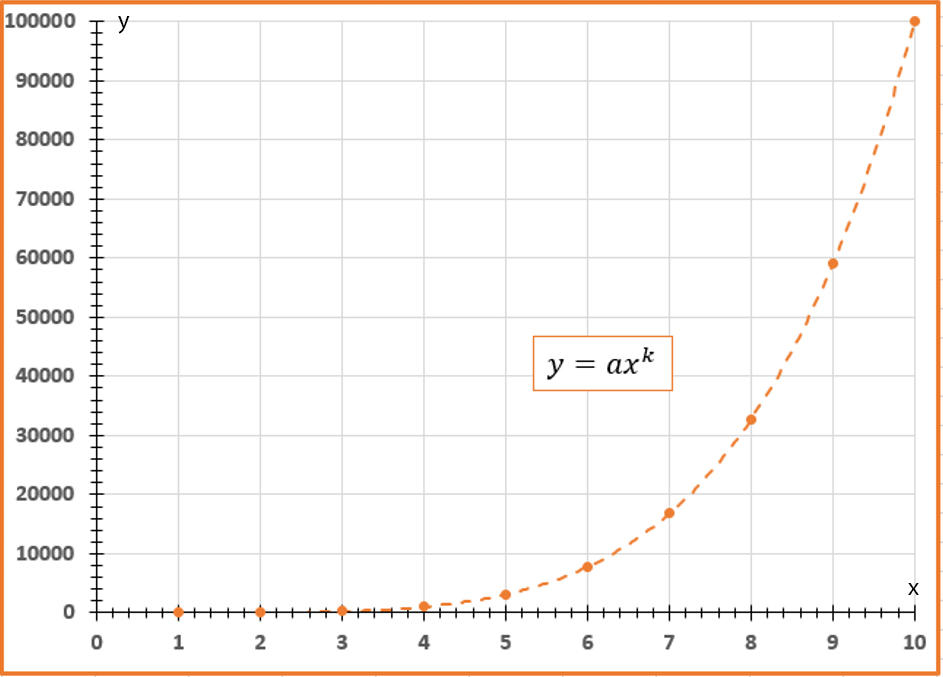
How would you adjust this graph to predict other values using the data points marked, and knowing that the trend line follows a general form of ?
Practice problem
How would you adjust this graph to predict other values using the data points marked, and knowing that the trend line follows a general form of ?