Practice problem
What Are Logarithmic Scales?
+1 contributors
Contributors

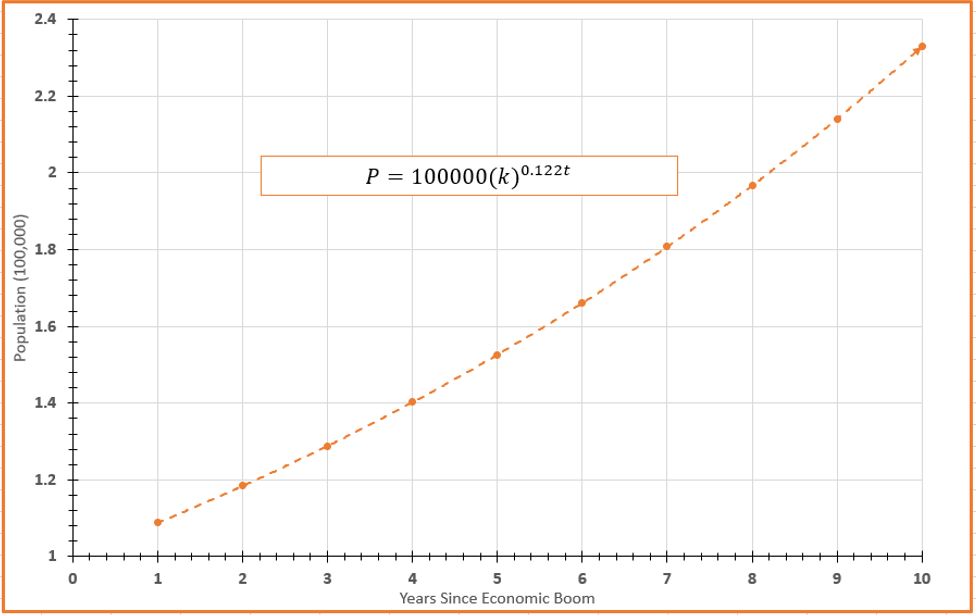
Above is a plot of a city's population since a recent economic boom. You know the population at the time of the "boom" was around . You also know the population has a growth rate of . However, you do not have the full equation and you want to predict the population in future years.
How can you adjust the graph to make a prediction more quickly?