Practice problem
What Is Evolution? — Definition & Overview
By Valeri Natole

+1 contributors
Contributors

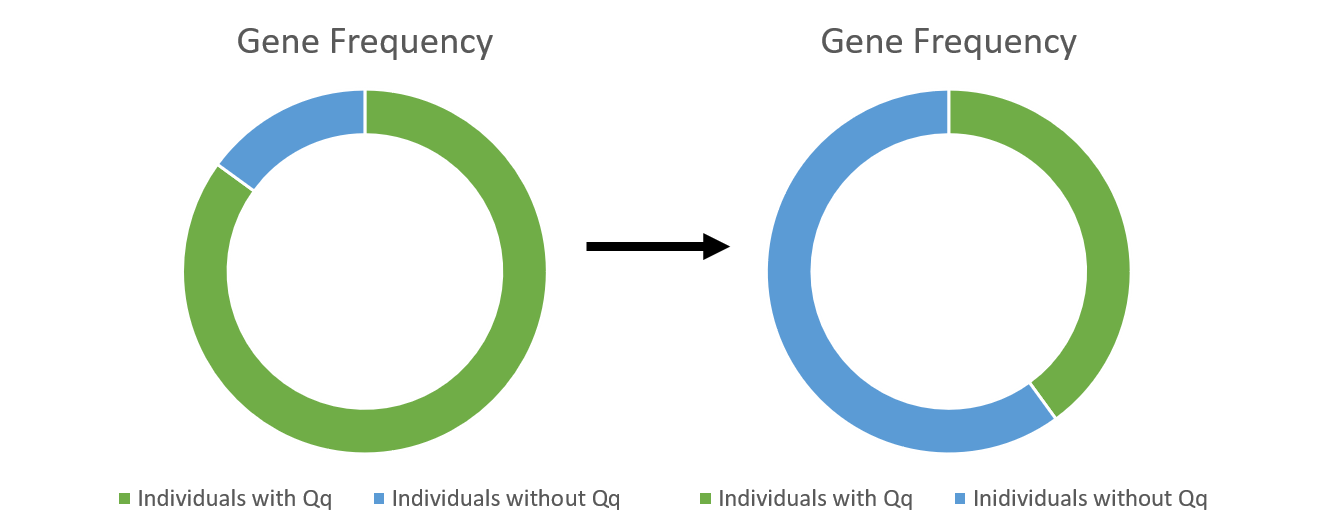
Qq is a genotype, where Q and q are alleles.
This chart represents the change in a rodent population over time. Which of these is most likely true?