Practice problem
Relation Between Length and Period
+1 contributors
Contributors

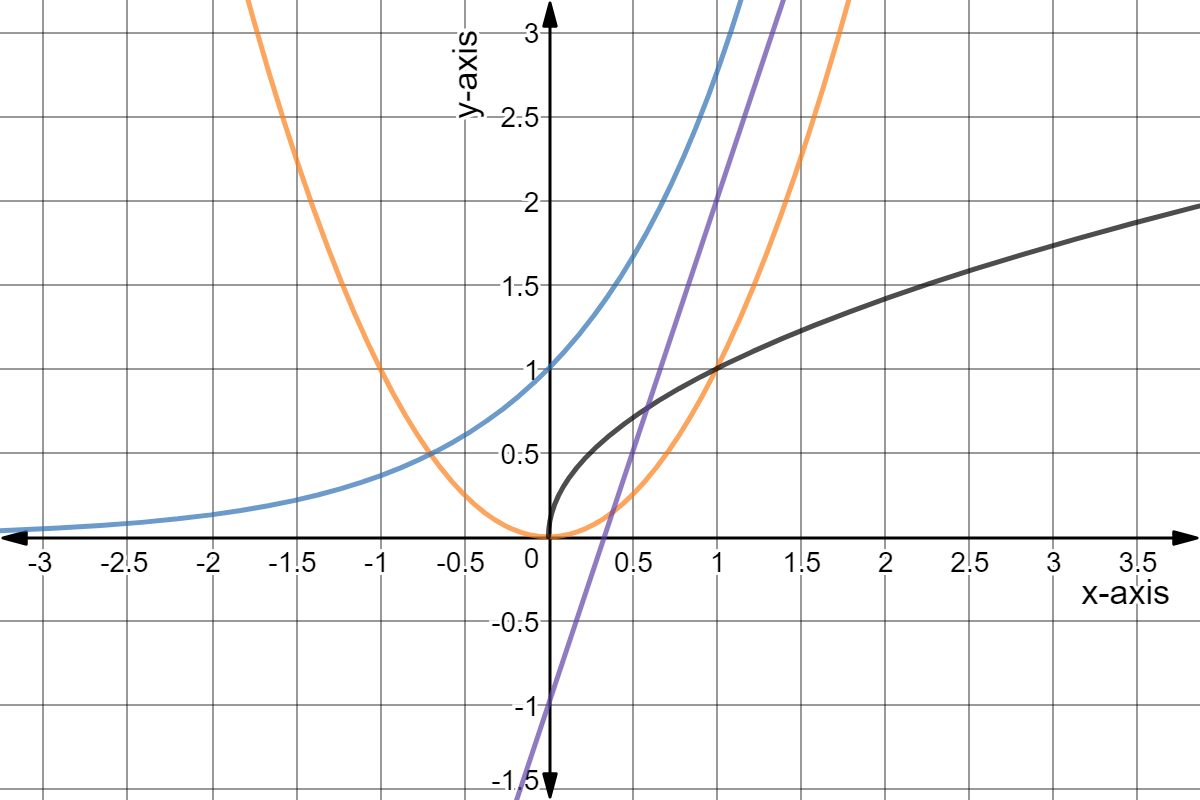
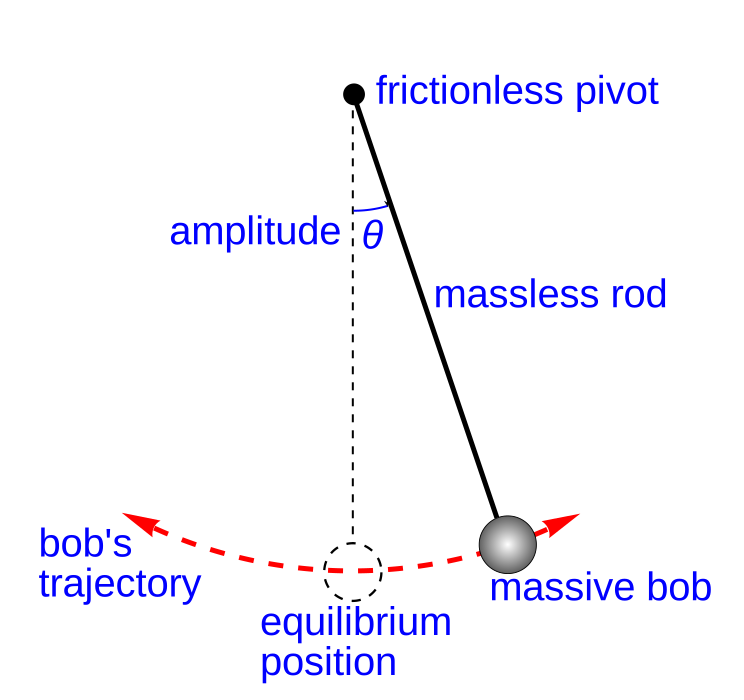
Tick Tock is performing experiments on pendulums. She wants to know how the length of a pendulum (measured in a unit of length) affects its period (measured in a unit of time). The period is the time it takes for the pendulum to swing back and forth once.

Which of the graphs shown above could represent the period as a function of pendulum length?