Practice problem
Scatter Plots: Correlation vs. Causation
+1 contributors
Contributors

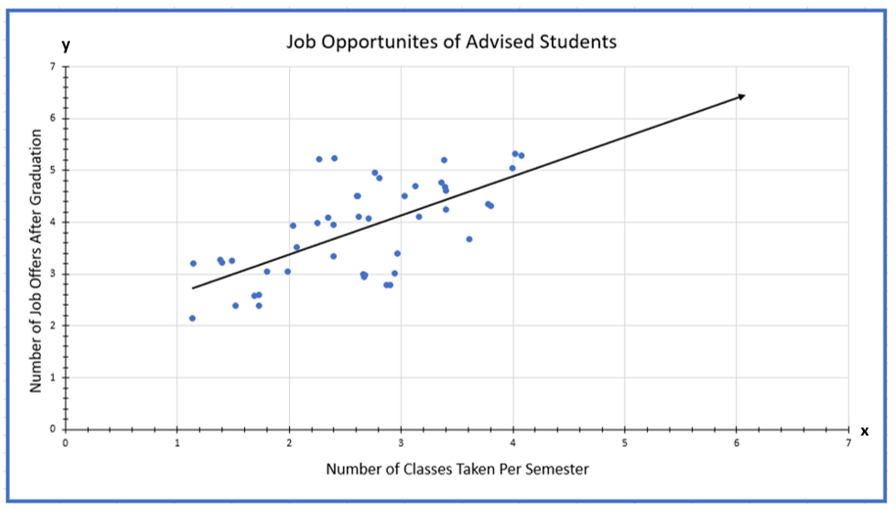
Dr. Johnson is an advisor at the local university. He decides to track the average number of classes his students take per semester and the number of job offers after graduation to track the effectiveness of his advising. This is the data he has. Can he say that the number of classes causes more job offers to come in?