Practice problem
Scatter Plots: Correlation vs. Causation
+1 contributors
Contributors

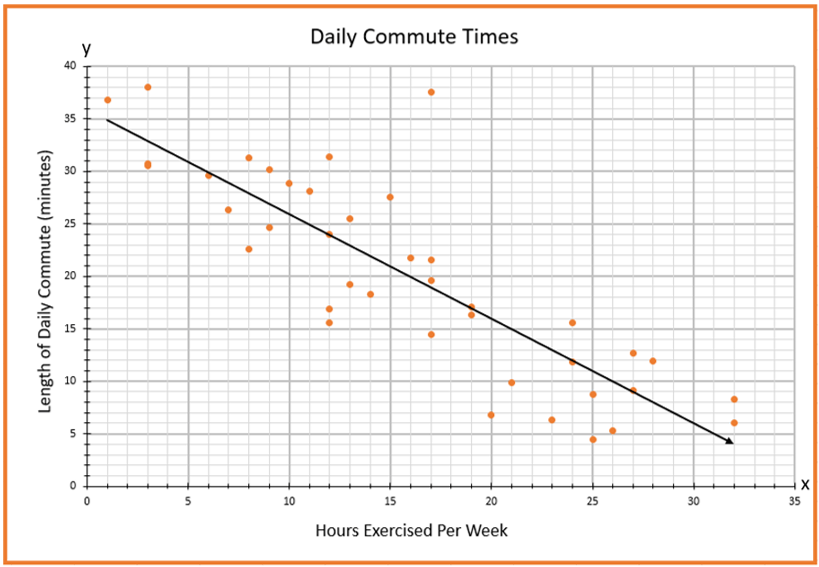
The above scatter plot graphs the number exercises per week in relation to the daily commute to work. Is this a case of causation or correlation?
Practice problem
The above scatter plot graphs the number exercises per week in relation to the daily commute to work. Is this a case of causation or correlation?