Practice problem
Scatter Plots: Correlation vs. Causation
+1 contributors
Contributors

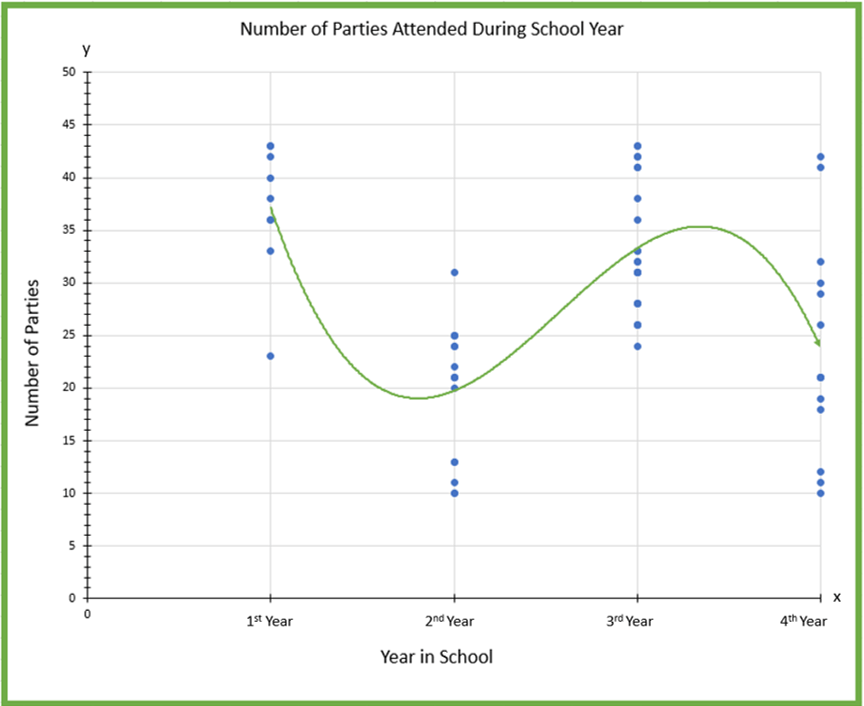
Dr. Nelson is a counselor at a local university and interviewed undergraduate college students, ranging from freshman to seniors, about their social habits at the end of the school year. This plot is the number of parties the individual students attended, sorted by their year. Dr. Nelson notices a trendline that follows a cubic pattern (some version of ). Is this a case of causation or correlation?