Practice problem
Scatter Plots: Correlation vs. Causation
+1 contributors
Contributors

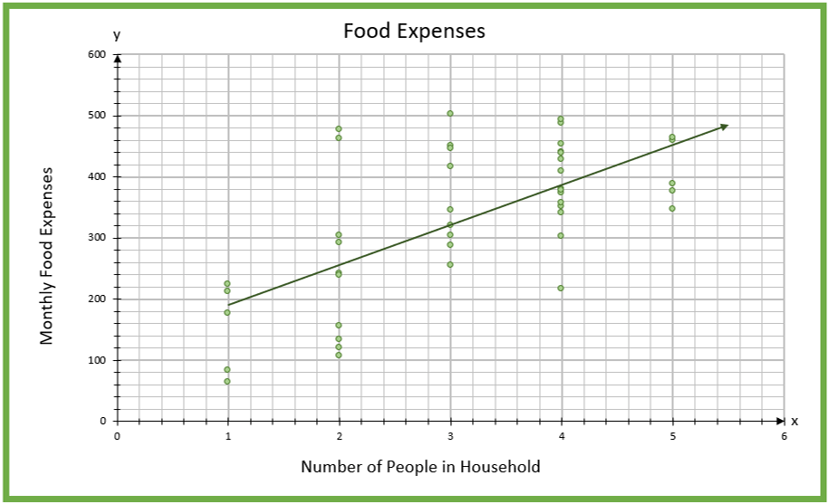
Above is a scatter plot of the monthly food expenses of an urban neighborhood. The monthly food expenses (dollars) are sorted by number of people in the household. Is this a case of causation or correlation?