Practice problem
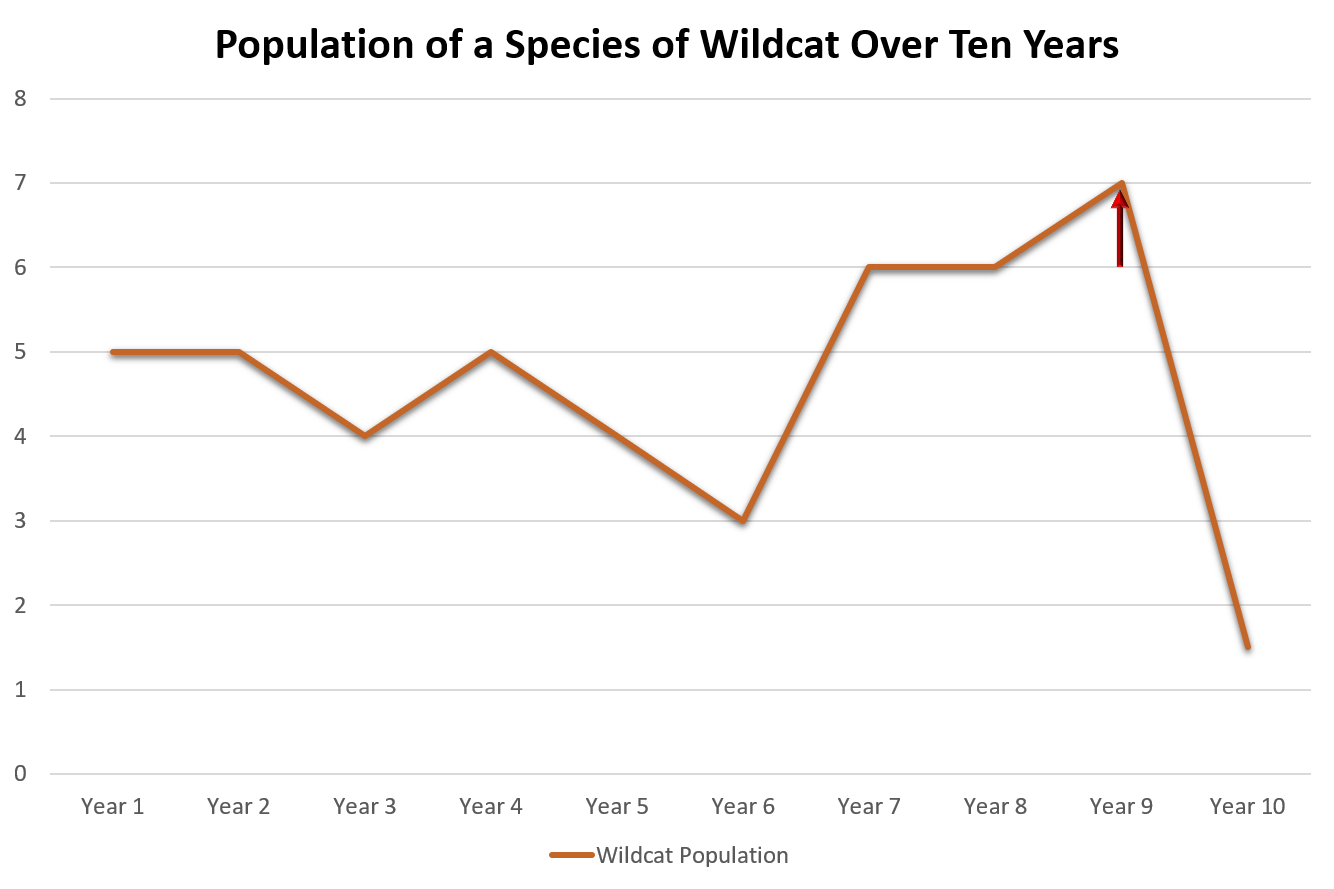
Predict what happened at the indicated time on the graph.
Sudden increase in food availability
Beginning of a slow change in climate
A natural disaster
Development of mutualism between wildcats and another species
Type a concept, like “slope” or “photosynthesis”.