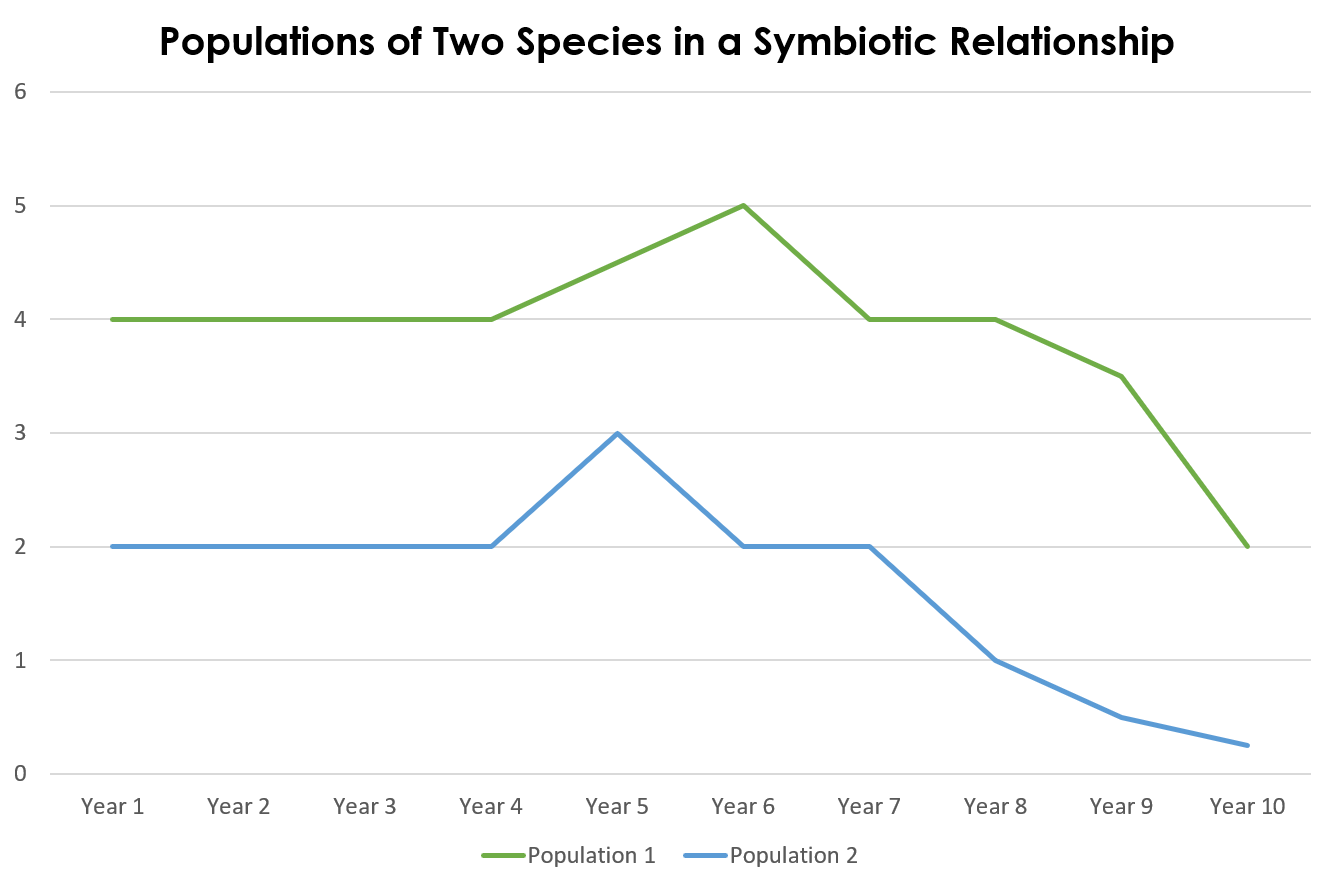
A graph showing the number of individuals in two populations, by the thousands, over 10 years. Population 1 has 4 individuals for four years, 4.5 in year 5, 5 in year 6, four in year 7 and 8, 3.5 in year 9, and 2 in year 10.  Population b has 2 individuals in years 1, 2, 3, 4, and 3 in year 5, 2 in year 6 and 7, 1 in year 8, 0.5 in year 9, and 0 in year 10.

A graph showing the number of individuals in two populations, by the thousands, over 10 years.

Based on the graph, what kind of biological interaction do Population 1 and Population 2 have?

Choose one answer

Type a concept, like “slope” or “photosynthesis”.

↑ ↓ to choose · Enter to openSearch explanations and problems